Incredible Charts Stock Market Charting Software. Home Site Map About Us Privacy Policy Advertise (pdf) Contact Us
 
 
sitesearch

Help Menu > Chart Time Period > Time Period Select
Help A ~ Z > T ~ Z > Time Period Select

Time Period

You can change the number of periods displayed on the chart to suit the time frame that you are analyzing.

  • Click on Time Period in the main menu.
  • Select a Time Period by clicking on the drop-down list.
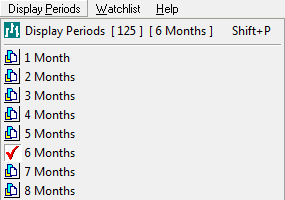
Select a Time Period

Zoom

  • You can enlarge the view of any time period using the Zoom function on the main menu.
  • To return to your previous setting click Reset Zoom on the main menu.

Scrolling Time Periods

The scrolling toolbar in the top right corner of the price chart enables you to scroll back and forward on the time scale.

scrolling toolbar
  • Scroll back or forward using the scroll back or scroll forwardbuttons
  • Use scroll end to reset to the latest time period.
  • Use scroll end to go to the start of the chart.

Adjust the Scroll Period

Right-click on the scrolling toolbar to change the interval.

change scrolling interval

Larger intervals will scroll faster.

Chart Complete Data

In order to improve loading speed, time periods are limited to 3 years. You can chart longer time periods if you override this default setting. The only limit is the amount of data on the server.

  • Select Time Period on the main menu.
  • Click Chart Complete Data on the drop-down menu.

Chart 3 Years Data

To improve the chart loading speed:

  • Select Time Period on the main menu.
  • Click Chart 3 Years Data on the drop-down menu.

Next: Daily, Weekly and Monthly Charts


Hourly ASX updates, ETOs & Warrants End-of-day NYSE, Nasdaq, Amex,OTCBB, Pink Sheets End-of-day LSE updates
Free !
Incredible Charts Pro 5
Free Download
Quick Tour (pdf)

 
Top of Page