Bollinger Bands: Trading Signals and Strategies
Bollinger Bands® indicate overbought and oversold levels relative to a moving average. They were invented by John Bollinger and are normally used to confirm trading signals, typically from a Momentum Indicator.
The bands are calculated at a specified number of standard deviations above and below the moving average, causing them to widen when prices are volatile and contract when prices are stable.
Bollinger originally used a 20 day simple moving average and set the bands at 2 standard deviations, suited to intermediate cycles.
Basic Trading Signals
Microsoft is shown with 20-day Bollinger Bands at 2 standard deviations.
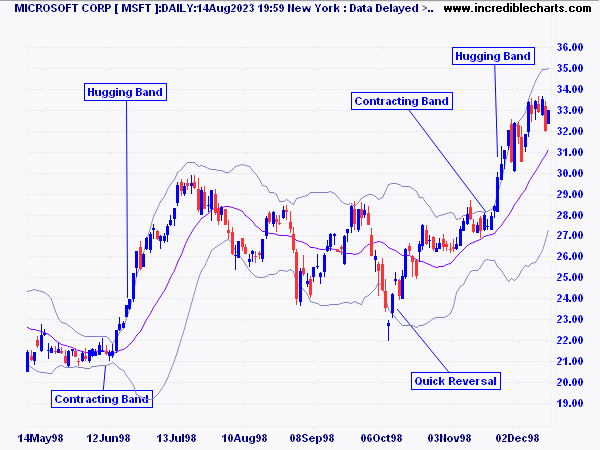
- Contracting Bands: warn that the market is about to trend: the bands first converge into a narrow neck, followed by a sharp price movement. The first breakout is often a false move, preceding a strong trend in the opposite direction. A contracting range [C] is evident in June 1998: the bands converge to a width of $2, followed by a breakout in July to a new high.
- Swings: in a ranging market, a move that starts at one band normally carries through to the opposite band.
- Breakouts and Reversals: a move outside the band indicates that the trend is strong and likely to continue. If price quickly reverses, however, expect a swing to the opposite band as with the quick reversal [QR] in early August.
- Trends: a trend that hugs one band signals a strong trend that is likely to continue. Traders often wait for divergence on a Momentum Indicator to warn that the trend is about to end.
Bollinger Band Squeeze Strategy
When bands contract in a narrow neck, the squeeze is highlighted by a sharp fall in Bollinger Band Width indicator as in the Microsoft [MSFT] chart below.

The traditional way of trading the Bollinger Band squeeze is on breakout above (or below) the bands after a squeeze. Now Microsoft had been trending upward since 2012 and another advance was likely. It is important to guard against fake signals in the opposite direction, like the one highlighted in mid-September 2016.

- Long entry
- Exit
- The red candle on Friday, September 9th closed below the lower band after a narrow Bollinger squeeze, signaling a downward break, before a large engulfing candle on Monday warned of reversal to an up-trend. The primary trend would alert traders to treat shorter-term bear signals with caution but it is also advisable to use Twiggs Money Flow to confirm buying or selling pressure. Here 21-day Twiggs Money Flow is oscillating above zero, indicating buying pressure despite the downward breakout. So the trade would be ignored.
- Subsequent rising troughs on Twiggs Money Flow would give me sufficient confidence to enter the trade [green arrow] before the next breakout, with a stop below the recent low at $56. More cautious traders would wait for breakout above the upper Bollinger Band but this often gives a wider risk margin because the stop should still be set below $56. The subsequent pull-back to test support in November 2016 underlines the need not to set stops at the breakout level.
- Exit [red arrow] on bearish divergence on Twiggs Money Flow, when the second dip crosses below zero, or if price closes below the lower Bollinger Band.
Bollinger Bands Trend-Following Strategy
The second strategy is a trend-following strategy I picked up from Nick Radge's book Unholy Grails, where he uses 100-day Bollinger Bands to capture trend momentum. The rules are simple:
- Enter when price closes above the upper Bollinger Band
- Exit when price closes below the lower Bollinger Band
Nick proposes setting the upper band at 3 standard deviations and the lower band at 1 standard deviation but I am wary of this (too much like curve-fitting) and would stick to bands at 2 standard deviations.
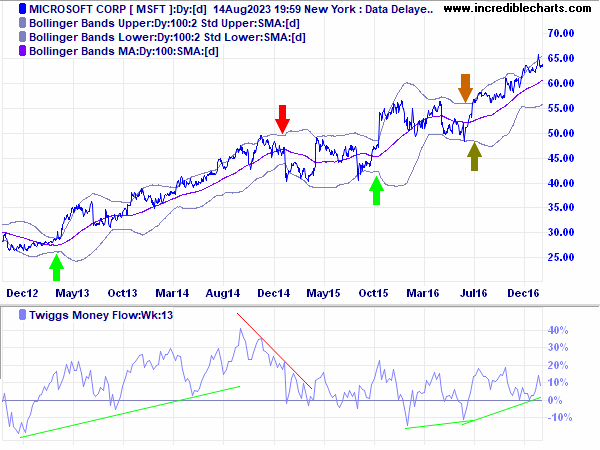
Here I have plotted Microsoft with 100-day Bollinger Bands at 2 standard deviations and 13-week Twiggs Money Flow to highlight long-term buying and selling pressure.
- Long entry
- Exit
- Invalid Exit
- Potential Entry
- Go long in 2013 when MSFT crosses above the upper Bollinger Band. Exit when price falls below the lower band in 2015.
- Ignore the next possible long entry signal in April 2015 because Twiggs Money Flow signals a bearish divergence.
- Go long in October 2015 when price closes above the upper band.
- The orange arrow in June 2016 highlights a potential exit when MSFT traded intra-day below the lower Bollinger Band. But the day's close is above the band, so this was not a valid exit signal.
- The olive green arrow in July 2016, when MSFT closed above the upper band, is therefore not an entry signal as the October 2015 trade is still open. But it can be used as an entry by traders who want to pyramid their position, with a stop below the recent low at $48.
If you would like to screen for this strategy using Incredible Charts 10.0 see: Screen for Trends using Bollinger Bands.
Evaluation
The problem with momentum strategies is steep drawdowns. Do not use this strategy to trade stocks when there is not a strong trend. Also, don't trade against the overall market. That is, don't short stocks in a bull market or go long in a bear market.
Setup
The default settings for Bollinger bands are 2.0 standard deviations around a 20 day exponential moving average. Edit Indicator Settings to change the standard settings.
See Indicator Panel for directions on how to set up an indicator.

Author: Colin Twiggs is a former investment banker with almost 40 years of experience in financial markets. He co-founded Incredible Charts and writes the popular Trading Diary and Patient Investor newsletters.
Using a top-down approach, Colin identifies key macro trends in the global economy before evaluating selected opportunities using a combination of fundamental and technical analysis.
Focusing on interest rates and financial market liquidity as primary drivers of the economic cycle, he warned of the 2008/2009 and 2020 bear markets well ahead of actual events.
He founded PVT Capital (AFSL No. 546090) in May 2023, which offers investment strategy and advice to wholesale clients.