Fibonacci Extensions
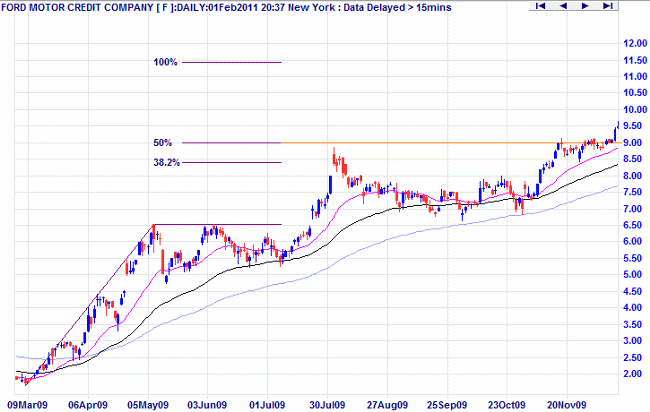
Fibonacci Extensions are used to project likely targets for the next leg of an up- or down-trend. Percentage extension levels, based on significant Fibonacci numbers, are plotted as horizontal lines above/below the previous trend move.
Draw Fibonacci Extensions
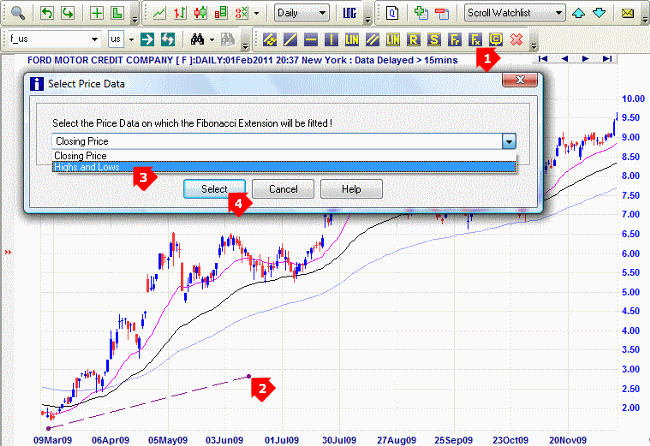
- Select Fibonacci Extensions from the Draw menu or toolbar
- Drag your mouse over the selected range (of the rally or decline)

- Select Highs and Lows for short-term charts or Closing Price for long-term
- Click the select button to complete the drawing.

Note how the next advance found resistance at the 50% level.
Set New Fibonacci Percentages
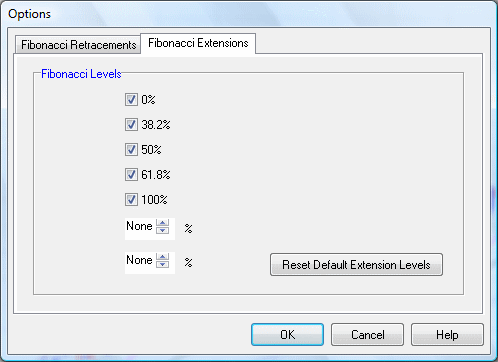
Add or delete Fibonacci levels by right-clicking on any Fibonacci Line and selecting Fibonacci Drawing Options (or select Draw >> Draw Options >> Fibonacci from the chart menu).

You can add further levels, remove existing levels or reset the default fibonacci levels.
Set Fibonacci Colors
Amend Fibonacci colors by right-clicking on any Fibonacci Line and selecting Adjust Line Color.
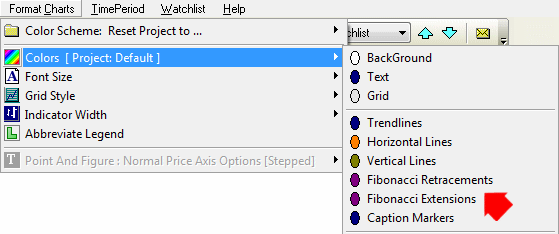
To change the default color for all Fibonacci lines, select Format Charts >> Colors >> Fibonacci Retracements (or Extensions) from the chart menu.

Delete Fibonacci Lines
To delete Fibonacci Lines, right-click on one of the lines and select Delete from the menu.
