Time Frames
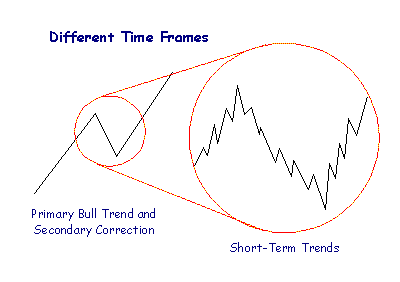
Markets often trend in more than one direction at the same time: The Dow can be in an upward bull trend (which may endure for several years); while the secondary cycle corrects downwards over several months; and a short-term rally occurs during the current week.
Market cycles may include:
- Long-term (or primary) trends that are measured in years;
- Intermediate (or secondary) trends of 3 weeks up to 6 months;
- Short-term cycles of less than 3 weeks; and
- Intra-day cycles.
What is important to
remember is that long-term trends influence short-term trends.
In an up-trend, rallies tend to be stronger than corrections. In a down-trend,
corrections are mostly stronger than rallies.
Unusual conditions can be created by the interaction of cycles in different time frames. They may offset each other or they may overlap and act in the same direction, resulting in an extreme peak or trough.
Chart Analysis
Avoid becoming hypnotized by movements on daily or intra-day charts. Always analyze charts in at least 2 time frames:
- Determine the strength and direction of longer term trends and
gauge their effect on the cycle being traded.
- Then analyze the cycle being traded.
Estimate the length of cycles by measuring the time taken between consecutive peaks (or troughs).