Interest rates
Interest rates are the primary tool of the Federal Reserve and central banks for implementing monetary policy. Interest rates are raised to tighten monetary policy and slow the economy -- and lowered to create liquidity and stimulate the economy.
The Impact of Interest Rates
Why do interest rates have such a big impact on the economy and on stock markets in particular? There are three major factors:
- When bond yields increase, investors are attracted away from equities.
- Higher interest rates on consumer debt means that consumers have less money to spend elsewhere. Further, purchases that require finance are deferred because of high finance charges. The result is that corporate sales and earnings suffer.
- In addition, earnings are reduced by the increased cost of corporate debt.
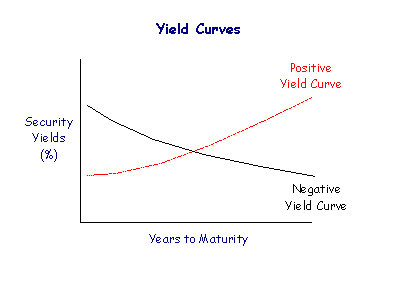
Reading a Yield Curve
The yield curve is the graph of yields on similar quality securities plotted against their maturity. In a normal market, short-term securities yield lower returns than investments with longer maturity - to persuade investors to tie up their money for the longer period.
A flat yield curve is detrimental to the profitability of banks, who pay mostly short-term rates to depositors while charging long-term rates to borrowers, and a long-term bear signal for equity markets.
A negative yield curve, where long-term rates are lower than short-term rates, is an even stronger bear signal. The Federal Reserve may be driving up short-term interest rates to slow the economy or investors may be switching out of equities into bonds - driving long-term yields down. A negative yield curve is usually followed by economic recession roughly 12 months later.
A steep yield curve is a bullish signal for stock investors. Investors may be switching out of bonds into equities, causing long-term yields to rise, or the Fed may be driving down short-term interest rates to stimulate the economy.
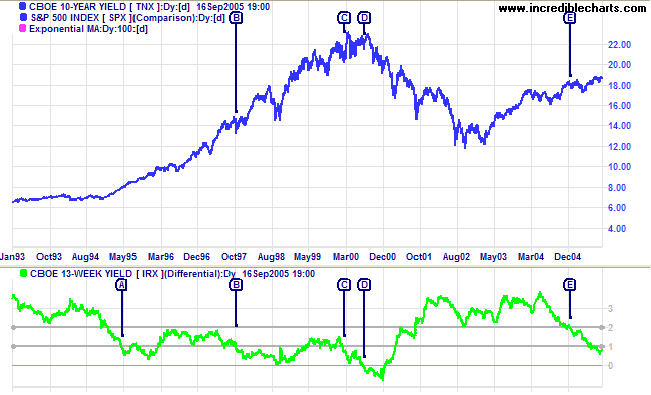
Chart the yield differential between ten-year Treasury notes and 13-week Treasury bills as an approximation of the yield curve:
- A yield differential above 2% is a positive sign, indicating a steep yield curve;
- A yield differential below 1% signifies a flat yield curve;
- A yield differential below zero signals a negative yield curve.

Author: Colin Twiggs is a former investment banker with almost 40 years of experience in financial markets. He co-founded Incredible Charts and writes the popular Trading Diary and Patient Investor newsletters.
Using a top-down approach, Colin identifies key macro trends in the global economy before evaluating selected opportunities using a combination of fundamental and technical analysis.
Focusing on interest rates and financial market liquidity as primary drivers of the economic cycle, he warned of the 2008/2009 and 2020 bear markets well ahead of actual events.
He founded PVT Capital (AFSL No. 546090) in May 2023, which offers investment strategy and advice to wholesale clients.