Incredible Charts Education offers a wide range of resources for DIY traders and investors.
What is Technical Analysis?
Technical analysis is the study of price and volume behavior in financial markets in order to anticipate future performance.
This is done through applying indicators to stock charts in order to highlight particular aspects and help with analysis.
Technical analysis is founded on three basic tenets from Dow Theory, underpinned by the concept of support and resistance.
Dow Theory lays out the basic principles of technical analysis, identifying trend changes as well as bull and bear markets.
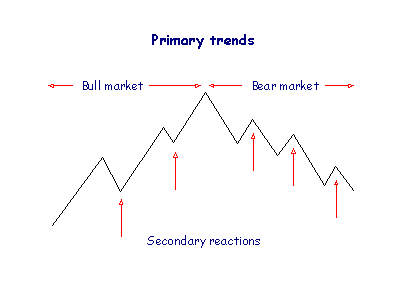
Dow Theory: Trends The ideas of Charles Dow, the first editor of the Wall Street Journal, form the basis of technical analysis today. Dow created the Industrial Average and believed that the behavior of the averages reflected the hopes and fears of the entire market
Dow Theory: Dividends and Earnings Charles Dow believed that stocks yielding below 3.5% were over-priced. Nowadays, we use Robert Shiller's CAPE or PE based on highest trailing earnings.
Warren Buffett Indicator Warren Buffett's indicator and the price-to-sales ratio for the S&P 500 avoid distortions from fluctuating earnings and profit margins.
Stock Market Cycles
Market Cycles Charles Dow identified three major stock market cycles -- Daily, Secondary, and Primary -- but there are heaps of others.
Coppock Indicator Edwin Coppock developed the Coppock Indicator with the sole purpose of identifying the commencement of bull markets.
Interest Rates & the Yield Curve Interest rates are the primary tool of the Federal Reserve and central banks for implementing monetary policy. The yield curve is a leading financial indicator of the business cycle.
Leading Market Indicators Colin Twiggs developed leading indicators for the ASX and US stock markets. Each leading indicator is a composite of key financial and economic indicators that highlight the start and end of bull and bear markets.
Stock Market Pricing We also offer stock market pricing indicators for the ASX and US stock markets, a composite of key valuation measures that reflect market buying opportunities and drawdown risk.
Candlestick Patterns
Candlestick chart patterns highlight trend weakness and reversal signals that may not be apparent on a normal bar chart.
Candlestick Patterns Candlestick chart patterns highlight trend weakness and reversal signals that may not be apparent on a normal bar chart.
8 Strongest Candlestick Patterns The eight most reliable Japanese Candlestick chart patterns, at least 3 times as likely to have a successful outcome.
Doji Candlesticks A doji candlestick is when the open and closing price are equal or close to equal.
Bullish Reversals Bullish Reversal Patterns tend to resolve in the opposite direction to the prevailing trend..
Bearish Reversals Bearish Reversal Patterns tend to resolve in the opposite direction to the prevailing trend.
Bullish Continuations Bullish Continuation Patterns are likely to resolve in the same direction as an existing up-trend.
Bearish Continuations Bearish Continuation Patterns are likely to resolve in the same direction as an existing down-trend.
Consolidation Patterns Consolidation Patterns are typically weak candlestick patterns that have close to an even chance of resolving in either direction.
Chart Patterns
Chart Patterns help to gauge trend strength and identify reversals. They are formed by support and resistance levels and by trendlines.
Daily Chart Patterns
Bar/OHLC Charts How to identify trends, control, commitment, uncertainty, inside and outside days.
Gaps Gaps are often found at breakouts or during a strong trend.
Wide Ranging Days A powerful signal, especially after big volume changes or a strong trend.
Spikes A spike is identified by a high sharply above the days on either side, a close near the day's low, and a strong preceding trend.
Volume Spikes Volume spikes above the normal range highlight unusual trading activity, as do volume dips with lower than normal volume.
Reversal Days
Reversal Days Every trend change is signaled by a reversal day. The secret is to identify their potency.
Closing Price Reversal A powerful reversal signal, especially with a large spike after a strong advance...
Hook Reversal An inside day that signals a fairly weak reversal...
Island Reversal Island reversals are powerful signals, identified by gaps between the signal day and the days on either side...
Key Reversal Key reversal signals do not occur very often but are definitely worth the wait...
Short-Term Chart Patterns
Short Term Support & Resistance When price falls to a new Low and then rallies, buyers who missed out on the first trough will be inclined to buy if price returns to that level.
Flags & Pennants Flags and pennants are short-term congestion patterns that form in trends and are reliable continuation signals.
Rectangles Rectangle patterns are of the most reliable chart patterns when they appear in close proximity to support or resistance during an up-trend.
Volume Patterns Volume activity provides powerful confirmation of price signals and often gives advance warning.
Long-Term Chart Patterns
Double Bottoms Double Bottom Patterns are useful reversal patterns in a downtrend. They are identified by measuring from the lowest trough to the level of the intervening peak.
Double Tops Double tops are useful reversal patterns in an uptrend, identified by two peaks of similar height, followed by a break below the intervening trough.
Head & Shoulders A powerful reversal signal, the head and shoulders pattern is completed by a lower peak followed by a break below the neckline.
Triple Tops Triple tops are similar to double tops and comprise three peaks of similar height.
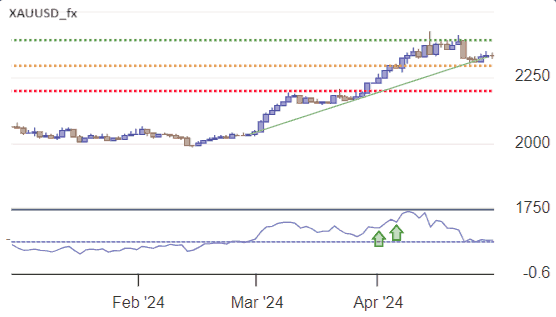
Support & Resistance Support and resistance levels are the foundation stone of all technical analysis.
Trading Ranges Trading Ranges are formed by support and resistance lines in close proximity. Price fluctuates in a narrow band with no clear trend.
Triangles & Wedges Triangle and wedge patterns can be powerful continuation or reversal patterns, depending on their shape.
Cup and Handle The Cup and Handle pattern is a reliable long-term continuation pattern first identified by William J. O'Neil.
Bear Traps Bear Traps are a vastly under-rated bull signal.
Point & Figure Chart Patterns
Basic Point & Figure Patterns Basic Point and Figure chart patterns: Support and resistance, trendlines, breakouts, bullish and bearish signals.
Bull & Bear Traps One of the most reliable Point and Figure chart patterns, Bull Traps occur when an upward breakout retreats back below the new support level.
Cup & Handle Identify the cup and handle pattern on Point and Figure charts. Popularized by William J O'Neill (How To Make Money In Stocks).
False Breaks Similar to Point and Figure bull and bear traps, false (or marginal) breaks occur at minor support levels (from a previous low) or minor resistance.
Retracements Retracements (or corrections), during a Point and Figure trend, tell us about the strength of the trend.
Spikes An upward Point and Figure spike is where a rally exceeds the previous column of Xs by at least 10 boxes.
Trend Reversals After a Point and Figure up-trend, marginal new highs (especially where accompanied by equal or lower lows) indicate a loss of momentum.
Triangles For a valid Point and Figure triangle there must be at least two retracements counter to the prevailing trend.
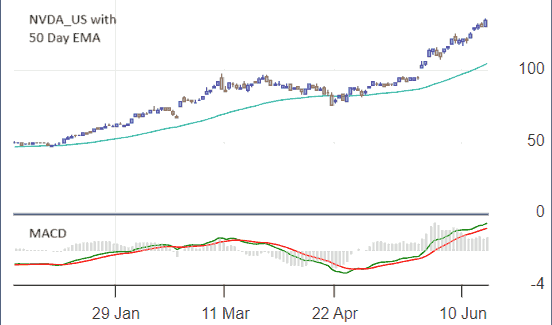
How to Use Technical Indicators
It is important to understand the technical indicators that you use, especially their strengths and weaknesses.
Indicators A ~ Z A complete guide to our library of Technical Indicators.
How to Trade Divergences and other Important Indicator Signals Always be on the lookout for price respecting a moving average, divergences between price action and momentum oscillators, and failure swings. These often give early warning of an impending change.
Stock Screener
Stock screens are valuable tools used to identify entry and exit signals when trading stocks. Filters include price, volume, and a host of technical indicators.
Colin Twiggs is a former investment banker with over 30 years experience in financial markets. He co-founded Incredible Charts and writes the popular Trading Diary and Patient Investor newsletters, focusing on the global market outlook and key macro trends.
Colin also founded PVT Capital (AFSL No. 546090) which provides investment strategy and advice to wholesale clients.