Dow Theory - Trends
The ideas of Charles Dow, the first editor of the Wall Street Journal, form the basis of technical analysis today.
Dow created the Industrial Average, of top blue chip stocks, and a second average of top railroad stocks. He believed that the behavior of the averages reflected the hopes and fears of the entire market. The trend patterns that he observed are recognizable in markets around the world.
Dow Theory is derived from editorials Dow wrote in The Wall Street Journal — until his death in 1902 — plus subsequent writings by his successor at the Wall Street Journal, William Peter Hamilton, and Robert Rhea who organized Dow and Hamilton's work into The Dow Theory, published in 1932.
Dow never used the term Dow Theory which was coined by S.A. Nelson. Nelson was a great admirer of Dow's work and, after failing to persuade Dow to publish a book on his unique perspective of stock market behavior, obtained permission to include a number of Dow's editorials in a book which he titled The ABC of Stock Speculation. The chapters were labeled as "Dow's Theory" and the name stuck.
The basic tenets of Dow Theory are set out below.
Three Movements
Markets fluctuate in more than one time frame at the same time:
Nothing is more certain than that the market has three well defined movements which fit into each other.
- The first is the daily variation due to local causes and the balance of buying and selling at that particular time.
- The secondary movement covers a period ranging from ten days to sixty days, averaging probably between thirty and forty days.
- The third move is the great swing covering from four to six years. (Nelson, 1903)
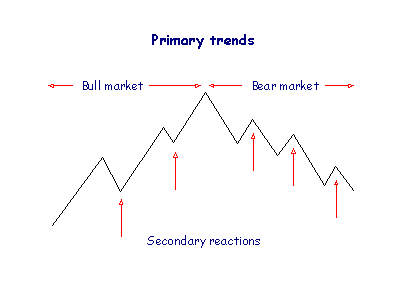
- Bull markets are broad upward movements of the market that may last several years, interrupted by secondary reactions. Bear markets are long declines interrupted by secondary rallies. These movements are referred to as the primary trend.
- Secondary movements normally retrace from one third to two thirds of the primary trend since the previous secondary movement.
- Daily fluctuations are important for short-term trading, but are unimportant in analysis of broad market movements.
Various cycles have subsequently been identified
within these broad categories.
Bull & Bear Trends
Dow recognized that trends changed when the pattern of peaks and troughs reversed.
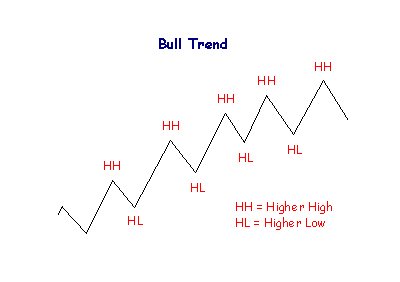
Bull Trends
A bull trend is identified by a series of rallies where each rally exceeds the highest point of the previous rally. The decline between rallies ends above the lowest point of the previous decline. A series of successive higher highs and higher lows.
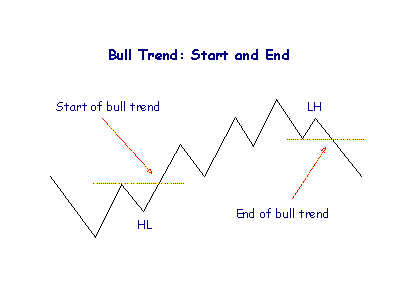
The start of an up trend is signaled when price makes a higher low (trough), followed by a rally above the previous high(peak):
Start = higher Low + break above previous High.
The end is signaled by a lower high (peak), followed by a decline below the previous low (trough):
End = lower High + break below previous Low.
What if the series of higher Highs and higher Lows is first broken by a lower Low? There are two possible interpretations - see Large Corrections.
Bear Trends
Each successive rally fails to penetrate the high point of the previous rally. Each decline terminates at a lower point than the preceding decline. A series of successive lower highs and lower lows.
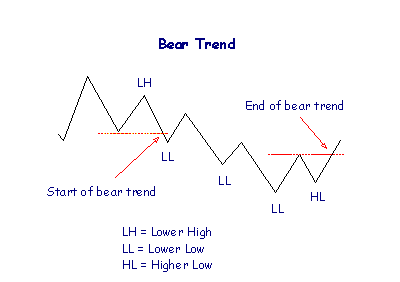
A bear trend starts at the end of a bull trend: when a rally ends with a lower peak and then retreats below the previous low. The end of a bear trend is identical to the start of a bull trend.
What if the series of lower Highs and lower Lows is first broken by a higher High? This is a gray area - see Large Corrections below.
Large Corrections
A large correction occurs when price falls below the previous low (during a bull trend) or where price rises above the previous high (in a bear trend).
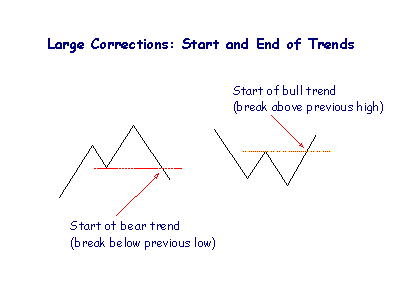
Some purists argue that a trend ends if the sequence of higher highs and higher lows is broken. Others argue that a bear trend has not started until there is a lower High and Low nor has a bull trend started until there is a higher Low and High.
For practical purposes, only accept large corrections as trend changes in the primary trend.
- A bull trend starts when price rallies above the previous high;
- A bull trend ends when price declines below the previous low;
- A bear trend starts at the end of a bull trend (and vice versa).
Trend Changes
A trend should always be treated as intact until there is a clear signal that the opposite trend has started.
Lines (Ranging Markets)
According to Dow Theory, a secondary reaction may take the form of a line which may endure for several weeks — where price fluctuates within a narrow range of about five per cent.
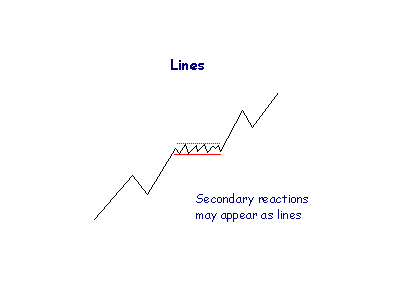
Breakouts from a range can occur in either direction.
- Advances above the upper limit of the line signal accumulation and higher prices;
- Declines below the lower limit indicate distribution and lower prices;
- Volume is used to confirm price breakouts.
See Trading Ranges for more detail.
Bull & Bear Market Phases
Primary (bull and bear) market movements have three phases. Look out for these general conditions:
Bull Markets
- Bull markets commence with reviving confidence as business conditions improve.
- Prices rise as the market responds to improved earnings
- Rampant speculation dominates the market and price advances are based on hopes and expectations rather than actual results.
Bear Markets
- Bear markets start with abandonment of the hopes and expectations that sustained inflated prices.
- Prices decline in response to disappointing earnings.
- Distress selling follows as speculators attempt to close out their positions and securities are sold without regard to their true value.
Volume Confirmation
Increased volume on declines and dull activity on rallies provide additional evidence of an overbought market. Conversely, lack of activity on declines and increased volume during rallies indicate an oversold market. See Volume Patterns for further detail.
Bull & Bear Market Confirmation
Dow split industrial stocks and railroad stocks into two separate averages. His theory requires that movements on one average be confirmed by the other:
- A bull market starts when a bull trend on one average is confirmed by
the other average commencing a bull trend.
- A bear market commences when a bear trend on one average is confirmed by the start of a bear trend on the other average.
The Railroad average has declined in significance over the years and the Dow Jones Transport Average is now used in its place.
Example
Dow Jones Industrial Average is compared to the Transport Average.
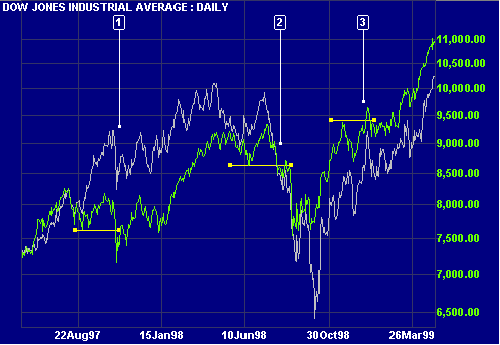
- The Transport Average fails to confirm the lower High and Low on the Industrial Average. The bull market is intact.
- The end of the bull market is confirmed by the lower High and Low on the DJTA and a large correction on the DJIA.
-
Higher Highs and Lows on both averages confirms the
resumption of the bull market.
Using The S&P 500 As An Alternative
Railroads have declined in importance since the early 1900s when they dominated the stock market. The Transport Average has expanded to include freight companies such as UPS and Fedex, airlines such as Southwest and Continental, and shipping companies such as OSG. Nevertheless, the index has declined in significance and many traders instead use the broader Standard & Poors 500 index to confirm Dow Industrial signals.
Dow Theory Summary
Markets fluctuate in three time frames: daily fluctuations, secondary corrections, and primary bull and bear markets.
Bull trends are identified by a series of higher highs and higher lows; bear trends by a series of lower highs and lows. Each trend is intact until the opposite trend commences.
Secondary reactions may take the shape of a line: a narrow consolidation with a range of 5% or less.
There are two averages: The Dow Jones Industrial Average and the Transportation Average. For a bull or bear market, a trend change on one average must be confirmed by a trend change on the other.
"It is not an infallible system for beating the market." ~ Robert Rhea.
The Dow Theory was created as a leading indicator of the business cycle. It should merely be used to indicate the direction of the primary trend — to be followed when trading individual stocks.

Author: Colin Twiggs is a former investment banker with almost 40 years of experience in financial markets. He co-founded Incredible Charts and writes the popular Trading Diary and Patient Investor newsletters.
Using a top-down approach, Colin identifies key macro trends in the global economy before evaluating selected opportunities using a combination of fundamental and technical analysis.
Focusing on interest rates and financial market liquidity as primary drivers of the economic cycle, he warned of the 2008/2009 and 2020 bear markets well ahead of actual events.
He founded PVT Capital (AFSL No. 546090) in May 2023, which offers investment strategy and advice to wholesale clients.