Point and Figure Charts: Trend Reversals
Trend Reversal Patterns
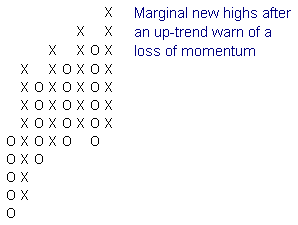
Point and Figure Charts: Loss of Momentum
After an up-trend, marginal new highs on the Point and Figure chart (especially where accompanied by equal or lower lows) indicate a loss of momentum and may evolve into a stage 3 top.
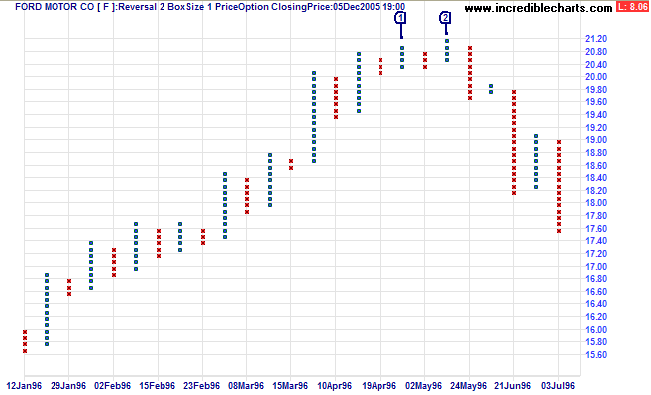
Here is a Point and Figure chart for Ford Motor Company. Note the marginal new highs at [1] and [2] before a strong trend reversal.
Point and Figure Charts: Marginal Higher Lows
In a down-trend, a series of higher lows indicate accumulation.
Equal or rising highs are a further bullish sign.
Enter on completion of the third higher low: the start of the
fourth column of Xs.
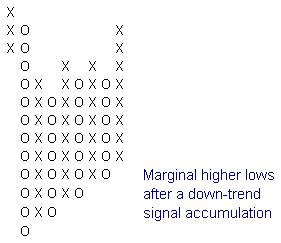
An inverse of the pattern in an up-trend, where you have several marginal lower highs, would be a strong bear signal.

Author: Colin Twiggs is a former investment banker with almost 40 years of experience in financial markets. He co-founded Incredible Charts and writes the popular Trading Diary and Patient Investor newsletters.
Using a top-down approach, Colin identifies key macro trends in the global economy before evaluating selected opportunities using a combination of fundamental and technical analysis.
Focusing on interest rates and financial market liquidity as primary drivers of the economic cycle, he warned of the 2008/2009 and 2020 bear markets well ahead of actual events.
He founded PVT Capital (AFSL No. 546090) in May 2023, which offers investment strategy and advice to wholesale clients.