Trading Traps
Market professionals use a number of tricks, or feints, to entice inexperienced traders or investors into buying or selling a targeted stock. Some of the most common are faking a breakout, shaking out the stops, and the longer term pump and dump.
False Breaks: the Fakeout
If a market professional sits with a large sell order and the stock is consolidating (a sign that the market is in equilibrium) he knows that he cannot merely dump his orders on the market. That would upset that equilibrium and he would be selling into a weak market, chasing prices down. The golden rule is: sell into strength, so our trader bides his time and waits for the market to test resistance at the top of the range. If impatient, he may even help to nudge prices across the line with a few well-timed buy orders.
As soon as price crosses the line there is a tremor of excitement. Conditional buy orders placed in anticipation of a breakout are triggered. Traders watching their screens notice the activity and send in a flood of new buy orders; everyone hopes to get on board before price rallies too far above the former resistance levels. And who is standing in the face of the rally, happy to accommodate them? Our market professional releases a steady stream of sell-orders into the market, careful not to saturate the market until he has offloaded most of his stock.
Other professionals pick up on what is happening and start shorting the stock. The rally fizzles and the punters are left high and dry. Price retreats back below the new support level (formerly resistance) and triggers their stops. A fresh round of selling ensues as the punters struggle to clear their positions. The professionals cover their short positions and go home having made a tidy profit for a few hours work. It's a hard game -- you have to live by your wits -- but the rewards are big.
Our market professional reports back to his clients that he has offloaded the large parcel of stock at well above the average price traded over the past few days. They congratulate themselves and are happy to pay his fat commission -- he has earned it.
Example
Westpac Banking Corporation on the ASX had started to rally in early 2003 after a broad double-bottom and a shakeout below $13.00. The stock entered a narrow consolidation, with low volume for the three days starting at [2]. A shakeout follows at [3]:
- a break through resistance;
- the rally meets with strong selling;
- price is driven back below the resistance level;
- all in the same day.
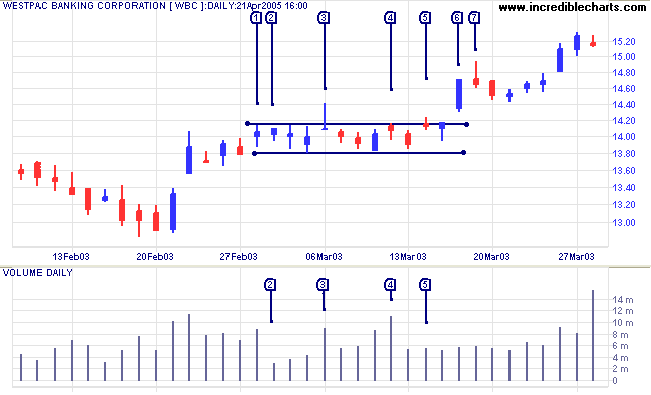
Punters are more cautious the second time at [5], with a narrow price range and lower volumes. Then we have a real breakout at [6], with a gap above the resistance line and a strong blue bar on average volume. The rally meets further selling at [7] before it continues on its' way.
Variations
Most false breaks expire on the same day but you do get larger patterns that occur over a week or more. These false breaks occur in a larger time frame. Broad patterns, encompassing a false break above a primary resistance level, are the most powerful and often forewarn of a primary trend reversal.
The Shakeout
A market professional wants to accumulate a large position in a stock that is trending strongly; either for his own account or for a major client. If he/she starts by placing buy orders in the pool, he will chase the stock up sky high, without being able to build a big enough line. The golden rule is: buy into weakness.
Patience
The professionals bides their time, waiting for the stock to consolidate or start a short-term correction. Trading will be quiet during this phase: buyers typically lose interest for a while and look elsewhere. They also can work out where most traders have their stops.
A few well-placed sell orders on a quiet day will drive the stock below its' support level. Stops are triggered, sending a flood of sell orders into the market. Everyone takes fright while our market professional steps forward and scoops the pool; buying in the face of the correction. Selling dries up when the stops are filled and the stock soon recovers back into its normal trading range. Everything returns to normal; except that our market professionals now have a sizeable parcel of stock, accumulated at low prices; and a group of punters cursing market volatility while the stock surges ahead.
Example
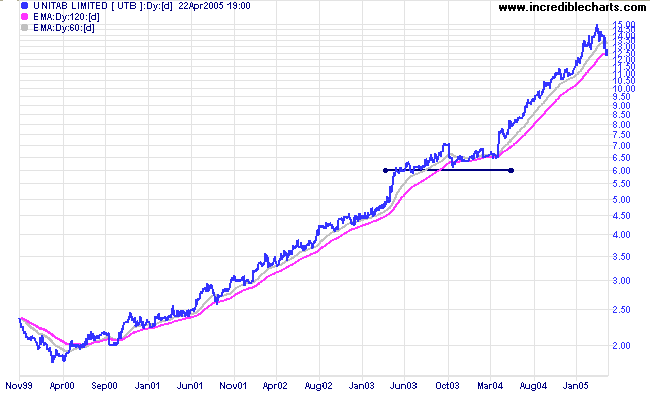
Unitab Limited holds various gambling monopolies in Australia. The stock had been in a strong up-trend for several years before a consolidation around $6.00.
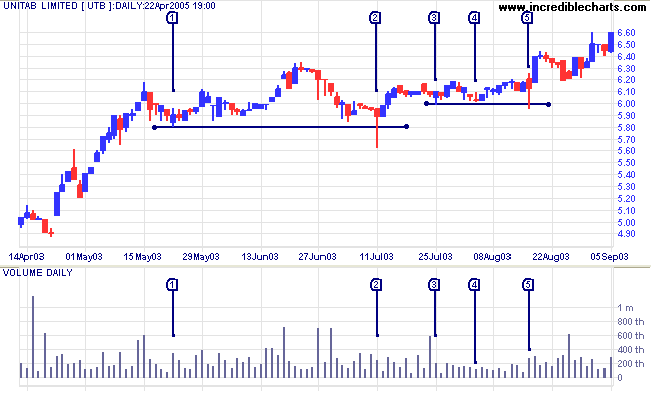
After a brief low (at [1] on the chart below) the stock consolidated for 2 months around the $6.00 mark before stops were triggered at [2] by a fall below $5.80. There was a flurry of selling, quickly scooped up by the market pros, with the stock retreating back above the support level before the close.
A further support level was established at $6.00, by lows at [3] and [4], before another shakeout at [5].
The Pump and Dump
Also referred to as ramping, this is an old trick often perpetrated by sly old hands who prey on newcomers.
The Ingredients
- One penny stock. Either a former high flier that has fallen from grace or a newer issue that failed to attract investor interest. It is important that the stock has been flat-lining at a few cents for the past 6 to 12 months.
- No institutional following. This is a key ingredient -- too many cooks may spoil the broth. Our chef does not want outside interference.
- Low liquidity. Often large tranches of stock in small companies are tied up in the hands of controlling interests, management, family interests or other connections who are not ready sellers.
- An industry that has the capacity to generate excitement - gold mining is the tried and trusted favorite but there are a number of new variations: dotcom, telecom, biotech, the list is endless. Basically anything that will make a good storyline.
- A large supply of mug punters, invited to the feast without realizing that they are the main course.
- A complete lack of conscience.
Preparation
Our chef will scan penny stocks until he finds a prospective target with a suitable storyline. A quick study of existing shareholders will reveal the float of stock that is available for purchase. He slowly accumulates a sizeable portion of the free float, careful not to give the game away. Bidding the price up too quickly would alert other traders before he is ready. When he has built up a sufficient line, our chef is ready to add the main ingredient.
Having cornered a sizeable chunk of the free float our chef befriends a few punters and lets them in on his find. He posts messages across all the popular investment forums, with headings like "The next ..." mentioning some recent stock that has taken off into the stratosphere. He will burley the water with "inside information" about new contracts in China or a gold strike in Indonesia. He will post several times a day, on the same thread. There will be much reference to "having gone into this in detail" -- thereby saving you the time -- and having an intimate knowledge of the company -- hinting at inside information. With little or no technical analysis, or else some shaky assertions about a double bottom, a broad base or a breakout, price targets are pulled out of thin air. If the stock is trading at 8 cents, we may see a claim that "this could go to $1.50" or similar extravagance.
The Recipe
Every time that our punters dive into the stock, the price goes up -- because our chef has cornered the free float and created a shortage. The more price rises, the more excited the punters become. Our hero is now acclaimed as a stock guru and his advice is eagerly sought on other new finds.
The rising price attracts more and more punters, eager to get in on the action, until there is a veritable feeding frenzy. At this stage our chef starts selling into the face of the rally, steadily offloading his line at a profit of several hundred percent. Buying is strong, so initially no one notices. Price no longer spurts ahead as before, but it still edges upwards, albeit on very heavy volume. Some of the volume and money flow indicators start to tick downwards. By this time our chef is cleaning out the remaining few stragglers before heading off for fresher pastures. He goes silent or, if he has a malicious streak, announces that he is "taking profits".
With buying support dissipated there is a rush for the exits. The stock tanks — falling back to the previous trading range and leaving our band of punters cursing their luck.
Examples
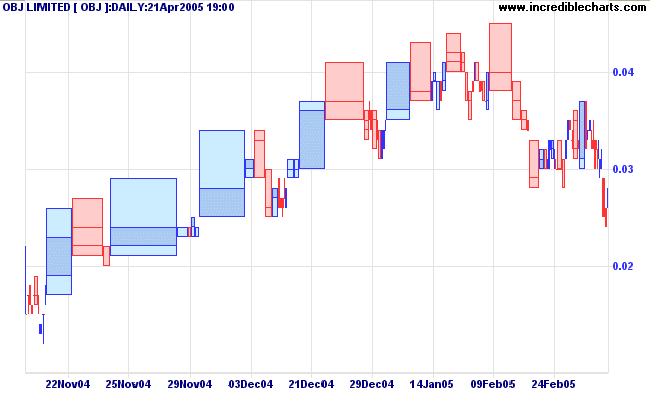
Despite huge trading volumes on this tiny software company, 21 day Twiggs Money Flow failed to cross into positive territory. Someone was selling a sizeable parcel of stock into the rally.
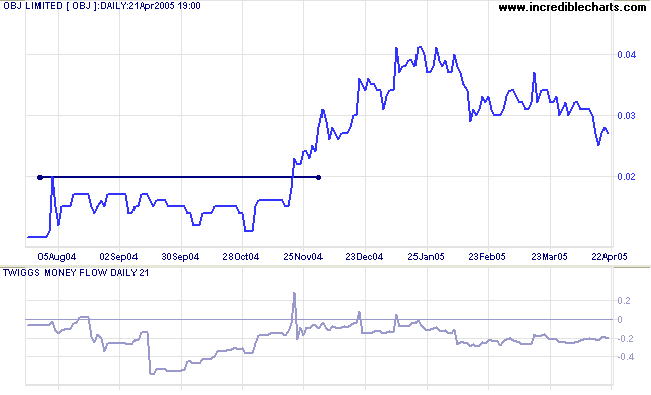
The equivolume chart tells the full story. Note the broad bars (width signifies volume) and tall shadows (weak closes) in the up-trend.
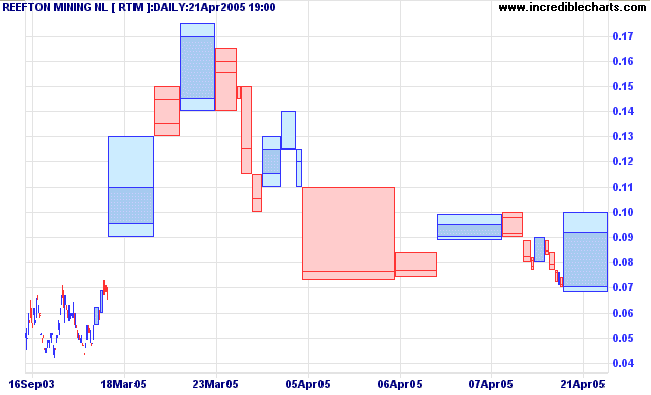
Gold mining is a perennial favorite. This small gold and nickel exploration company shows similar activity.
The Moral of the Story
Stay out of small caps until you are wise to the tricks of the trade.
Do your own research and treat everyone else's with a healthy skepticism:
If it sounds too good to be true — it usually is.

Author: Colin Twiggs is a former investment banker with almost 40 years of experience in financial markets. He co-founded Incredible Charts and writes the popular Trading Diary and Patient Investor newsletters.
Using a top-down approach, Colin identifies key macro trends in the global economy before evaluating selected opportunities using a combination of fundamental and technical analysis.
Focusing on interest rates and financial market liquidity as primary drivers of the economic cycle, he warned of the 2008/2009 and 2020 bear markets well ahead of actual events.
He founded PVT Capital (AFSL No. 546090) in May 2023, which offers investment strategy and advice to wholesale clients.