Cup and Handle Pattern
Cup and handle patterns were first identified by William J O'Neil in his book How To Make Money In Stocks. The cup and handle is a longer term continuation pattern, normally observed on weekly charts.
The cup and handle forms as an intermediate/secondary cycle correction before the primary cycle resumes its up-trend. The pattern is a form of (ascending) triangle.
The cup pattern should take a minimum of 7 weeks to form. There is no upper limit with some patterns taking as long as a year. The handle may form over one or two weeks but may also take several months.
Example
Newcrest Mining Limited (Australia) exhibits 2 cup and handle patterns over 1998/1999.
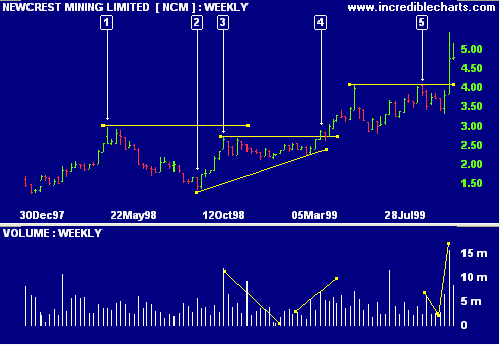
- The cup commences with a new peak [1], formed after a strong up-trend.
- A secondary correction occurs, with price falling +/- 50% from the peak at [1]. This is high - cup and handle corrections normally vary between 10% and 30%.
- The stock then forms a second peak at [3], slightly lower than the first.
- The handle is completed [4] when price breaks above the intervening peak [3]. The handle should form in the top half of the cup pattern, with volume contracting as the trough forms and then expanding on the breakout.
- A smaller cup and handle pattern follows with the cup completed at [5] and the handle completed by the subsequent breakout above $4.00. Again, observe how volume contracts as the handle forms and then rises sharply at the breakout.
Patterns to avoid:
- "Cups" with a sharp "V" bottom. The more "U" shaped the cup bottom is, the stronger the signal.
- Handles which are too deep. The handle should form in the top half of the cup pattern.
Volume Confirmation
Volume should contract as the handle forms and then expand on the breakout.
Trading Signals
Go long at the breakout from the handle pattern with a stop below the most recent low in the handle pattern.
Example
United Energy Limited (Australia) shows a cup and handle pattern.
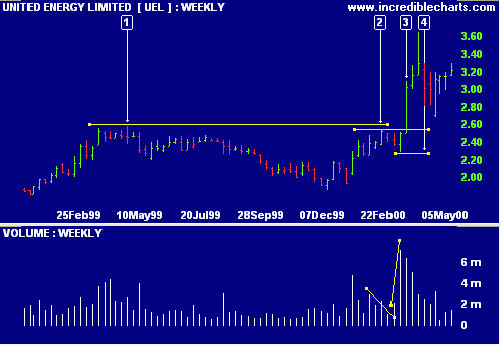
- Start of the cup pattern.
- The intervening peak completes the "cup" and starts the "handle".
- Go long at the breakout [3] above the high of [2].
- Place a stop-loss below the most recent low in the handle pattern.

Author: Colin Twiggs is a former investment banker with almost 40 years of experience in financial markets. He co-founded Incredible Charts and writes the popular Trading Diary and Patient Investor newsletters.
Using a top-down approach, Colin identifies key macro trends in the global economy before evaluating selected opportunities using a combination of fundamental and technical analysis.
Focusing on interest rates and financial market liquidity as primary drivers of the economic cycle, he warned of the 2008/2009 and 2020 bear markets well ahead of actual events.
He founded PVT Capital (AFSL No. 546090) in May 2023, which offers investment strategy and advice to wholesale clients.