Double Top Pattern
What is a Double Top Pattern?
Double tops are useful reversal patterns in an up-trend.
They are identified by two peaks of similar height, followed by a break below the level of the intervening trough. They are treacherous to trade, partly because of their similarity to triple tops and trading ranges.
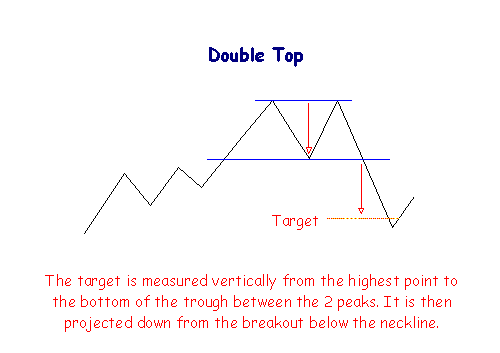
The target for a breakout move is measured vertically from the highest peak to the support line drawn through the intervening trough. This is then projected downwards from the breakout point.
Volume confirmation
Reduced volume on the second peak followed by increased volume on the break below the support line.
Trading Signals
Go short on a break below the support line.
Place a stop-loss just above the last peak.
Price often rallies back to the support line which then acts as a resistance level. Go short on a reversal signal and place a stop-loss just above the resistance level.

Author: Colin Twiggs is a former investment banker with almost 40 years of experience in financial markets. He co-founded Incredible Charts and writes the popular Trading Diary and Patient Investor newsletters.
Using a top-down approach, Colin identifies key macro trends in the global economy before evaluating selected opportunities using a combination of fundamental and technical analysis.
Focusing on interest rates and financial market liquidity as primary drivers of the economic cycle, he warned of the 2008/2009 and 2020 bear markets well ahead of actual events.
He founded PVT Capital (AFSL No. 546090) in May 2023, which offers investment strategy and advice to wholesale clients.