Point and Figure Charts: Cup & Handle
Cup and Handle Chart Pattern
The cup and handle pattern was popularized by William J O'Neil (How to Make Money in Stocks) though some would also fit the definition of a large ascending triangle. Criteria for the pattern are:
- It must occur in an up-trend; and
- The handle should not be more than half the depth of the cup.
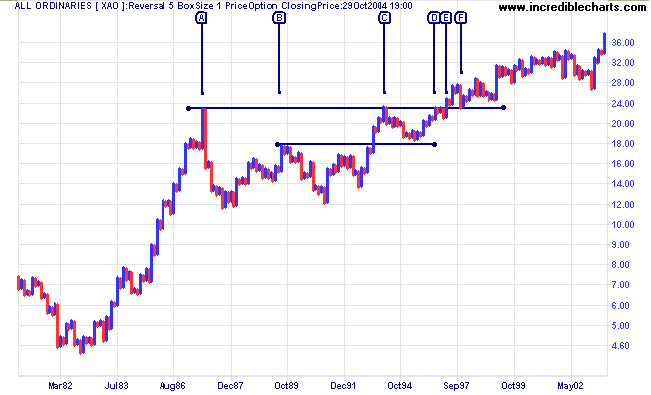
The cup and handle on the Australian All Ordinaries is the largest such Point and Figure pattern that I have encountered, lasting almost 10 years. The cup runs from [A] to [C] and the handle from [C] until the breakout at [E].

Some observations:
- The handle pulls back less than half-way, to successfully test support at the mid-point of the cup [B];
- There is a brief consolidation [D] to [E] below the major Point and Figure resistance level: a bullish sign before the breakout [E];
- The breakout at [E] is immediately followed by an intermediate pull-back to test the new Point and Figure support level; and
- A further, longer-term pull-back follows a year later at [F].

Author: Colin Twiggs is a former investment banker with almost 40 years of experience in financial markets. He co-founded Incredible Charts and writes the popular Trading Diary and Patient Investor newsletters.
Using a top-down approach, Colin identifies key macro trends in the global economy before evaluating selected opportunities using a combination of fundamental and technical analysis.
Focusing on interest rates and financial market liquidity as primary drivers of the economic cycle, he warned of the 2008/2009 and 2020 bear markets well ahead of actual events.
He founded PVT Capital (AFSL No. 546090) in May 2023, which offers investment strategy and advice to wholesale clients.
