Dow Theory: Dividends & Earnings
Charles Dow believed that stocks yielding below 3.5 percent where over-priced "except there be some special reason." Richard Russell analyzed the dividend yield on the Dow from 1929 to 1959 and found that the market tended to reverse when yields had fallen to between 3 and 4 percent.
Dividend Yield
Since the 1960s the dividend yield on the Dow and S&P 500 has declined to around 2 percent. We should be careful not to leap to the conclusion that the market is way over-valued. Examine the S&P 500 chart below and you will observe that the Dividend Payout Ratio declined over the same period, from 60 to 30 percent.
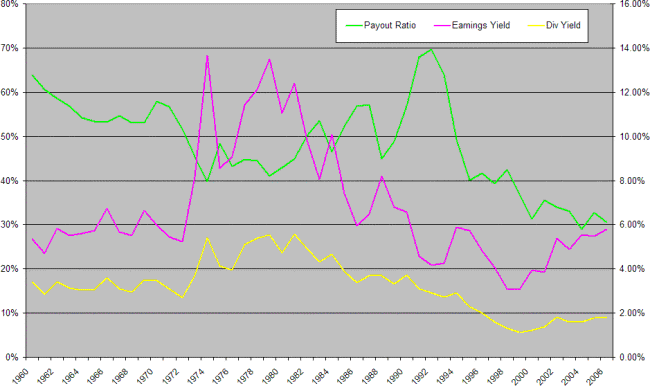
Companies are retaining a higher percentage of earnings, preferring to return capital to stockholders by way of share buy-backs rather than by way of dividends. This favors investors who prefer the enhanced earnings growth offered by share buy-backs, without the tax implications associated with dividends.
Earnings Yield
We should switch our focus to earnings yield, rather than dividend yield, in order to avoid any distortion. An earnings yield of below 5.0 percent would offer a similar over-bought signal to a dividend yield of less than 3.5 percent (0.035/0.7=0.05). This translates to a price-earnings (PE) ratio above 20. We use a PE ratio above 20 to signal that a bull market is in phase 3, where "prices advance on hopes and expectations rather than actual results."
Shiller's CAPE versus Highest Trailing PE
Price-Earnings Ratio is sometimes distorted by sharp falls in earnings which are normally temporary in nature and make comparison of historic PEs difficult.
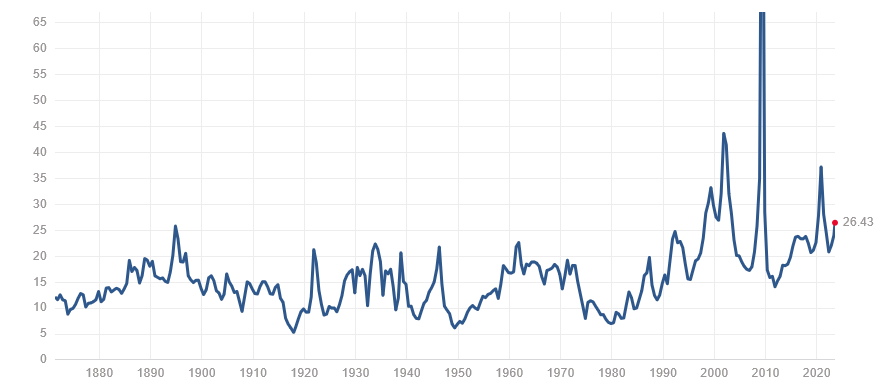
Robert Shiller attempted to overcome this by using a 10-year average of inflation-adjusted earnings in his CAPE model. But CAPE can still be distorted by base effects, with extreme lows often followed by extreme highs.
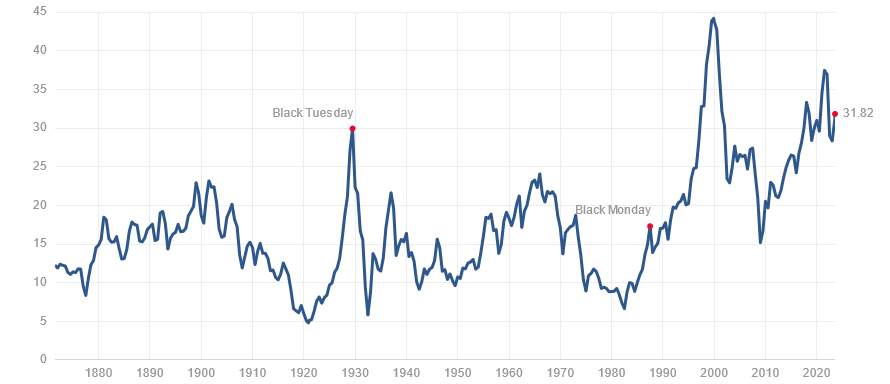
Instead, we prefer to use Price-to-earnings based on highest trailing earnings. If earnings for any 12-month period are lower than the preceding period, then the higher value is used. This is based on the assumption that a temporary fall in earnings is unlikely to affect future earning capacity and earnings are likely to rebound fairly quickly.
The chart below shows that current price-to-earnings based on highest trailing earnings for the S&P 500 is elevated. The current value of 22.06 is higher than earlier peaks before Black Friday in 1929 and Black Monday in 1987.

Summary
Dividend yields are no longer reliable because of the distortion caused by buybacks. Instead we compare price to earnings (PE).
Historic PE is distorted by sharp falls in earnings that do not reflect a permanent decline in earnings capacity. Robert Shiller attempted to compensate for this in his CAPE model but CAPE can still be distorted by base effects from the 10-year average of inflation-adjusted earnings.
We prefer to use PE based on highest trailing earnings. This removes the distortion from sharp falls in earnings while avoiding base effects as with CAPE.

Author: Colin Twiggs is a former investment banker with almost 40 years of experience in financial markets. He co-founded Incredible Charts and writes the popular Trading Diary and Patient Investor newsletters.
Using a top-down approach, Colin identifies key macro trends in the global economy before evaluating selected opportunities using a combination of fundamental and technical analysis.
Focusing on interest rates and financial market liquidity as primary drivers of the economic cycle, he warned of the 2008/2009 and 2020 bear markets well ahead of actual events.
He founded PVT Capital (AFSL No. 546090) in May 2023, which offers investment strategy and advice to wholesale clients.