Bar Chart (OHLC)
Each bar on a bar chart represents price performance for a specific period. These periods could be as long as a month or as short as one minute, depending on the purpose for which the chart is to be used. Daily bar charts are the most popular.
OHLC
OHLC stands for the 4 elements displayed on a typical price bar:
- opening price;
- highest price;
- lowest price; and
- closing price.

On Incredible Charts OHLC bars are colored red and green/blue:
- If today's close is higher than yesterday's close - the bar is colored green/blue.
- If today's close is lower than yesterday's close - the bar is colored red.
- If today's close is equal to yesterday's close - the bar is colored the same as yesterday.
Interpreting Bar Charts
Your first step in interpreting a bar chart is to identify the direction of the trend. Then look for signs that the trend is either strengthening or weakening.
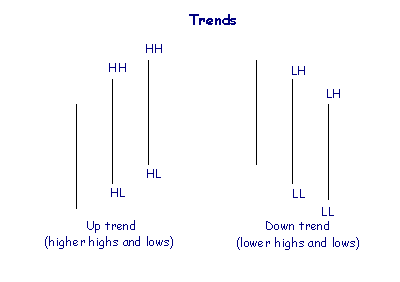
Identifying the Trend
The trend is determined in accordance with Dow theory. An up-trend is a series of bars with higher highs and higher lows. A down-trend is a series of bars with lower highs and lower lows.
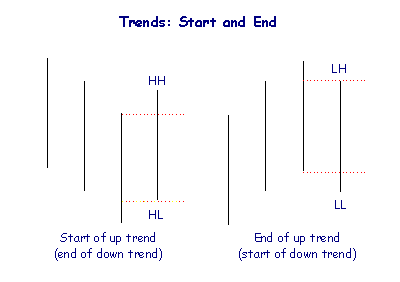
When does a Trend Start and End?
An up trend is started by a bar with a higher high and higher low than the previous bar. Conversely, a down trend is started by a bar with a lower high and lower low than the previous bar.
When is a Trend Uncertain?
Often trends are not very clear with uncertainty among buyers and sellers. Inside days, outside days and borderline days are signs of uncertainty in a trend.
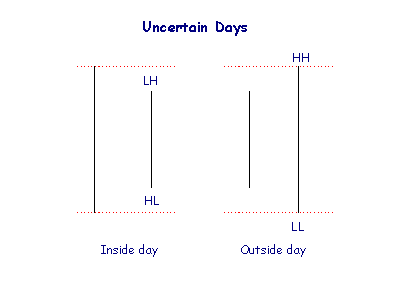
- Inside days have a lower high and a higher low when compared to the preceding bar.
- Outside days have both a higher high and a lower low than the previous day.
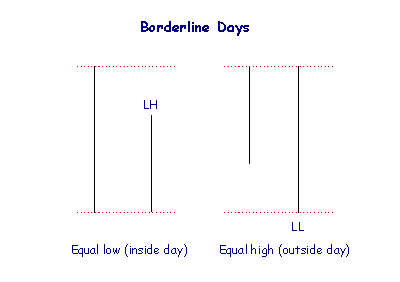
- Borderline days are similar to inside or outside days - except that there is an equal high or equal low.
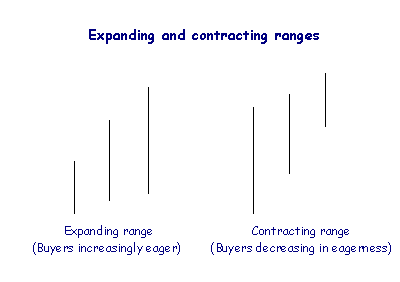
Expanding and Contracting Ranges
Expanding ranges in an up trend signal increasing eagerness from buyers and increasing eagerness from sellers in a down trend. Contracting ranges show decreasing eagerness.
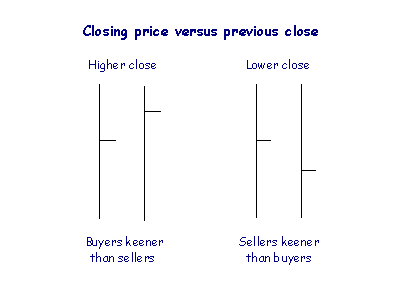
Closing Price: Up or Down?
The eagerness of buyers and sellers is indicated by the position of the closing price in relation to the close on the preceding bar. The larger the distance - the greater the eagerness.
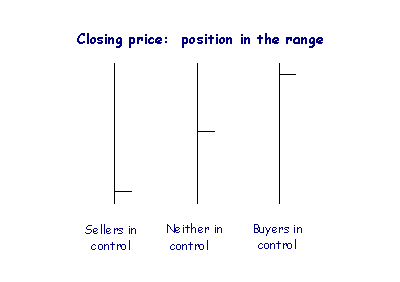
Closing Price Compared to the Range
The range is the distance between the high and the low on a bar. The position of closing price on the bar indicates who controls the market at the end of the day, and their level of commitment.
- Closing price at the top of the bar signals that buyers have control. If they are committed they will buy into the close of the market, with less profit-taking, and move price towards the high for the day.
- Closing price at the bottom of the bar indicates that sellers have control. If they are committed they will sell into the close and move price towards the low for the day.
- If neither party is committed then price is likely to close towards the middle of the range as profit-taking retraces part of the gains or losses for the day.
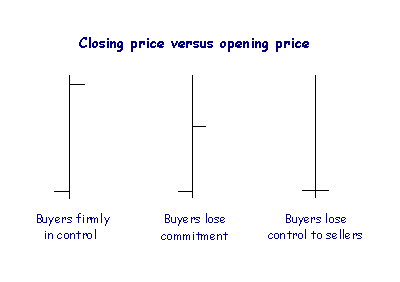
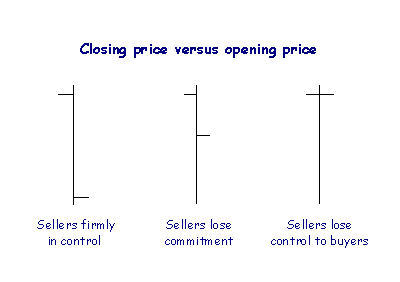
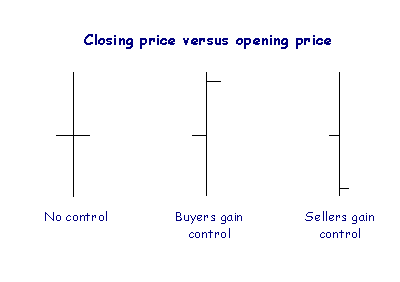
Closing Price Relative to Opening Price
The daily opening price tends to reflect the view of smaller buyers and sellers. It is useful as an indicator of the emotional direction of the market.
- Opening price at the bottom of the range indicates that buyers are in control.
- Opening price at the top of the range indicates that sellers have control.
- Opening price mid-way up the bar indicates that neither party has control.
Conflicting Signals
Conflicting signals show indecision and a weakening trend. Be on the alert for a trend reversal, but remember the Golden Rule: Never assume that a trend has ended until there are clear signals that the opposite trend has started.

Author: Colin Twiggs is a former investment banker with almost 40 years of experience in financial markets. He co-founded Incredible Charts and writes the popular Trading Diary and Patient Investor newsletters.
Using a top-down approach, Colin identifies key macro trends in the global economy before evaluating selected opportunities using a combination of fundamental and technical analysis.
Focusing on interest rates and financial market liquidity as primary drivers of the economic cycle, he warned of the 2008/2009 and 2020 bear markets well ahead of actual events.
He founded PVT Capital (AFSL No. 546090) in May 2023, which offers investment strategy and advice to wholesale clients.