Head and Shoulders Pattern
Head and Shoulders Pattern
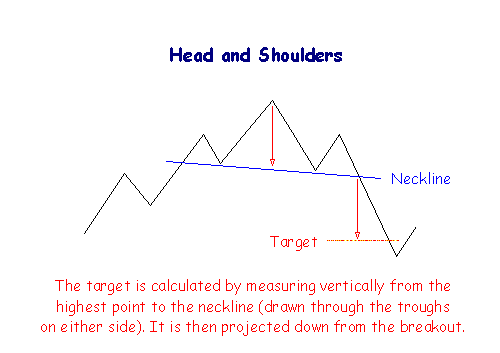
A head and shoulders pattern consists of a peak followed by a higher peak and then a lower peak with a break below the neckline. The neckline is drawn through the lowest points of the two intervening troughs and may slope upward or downward. A downward sloping neckline is more reliable as a signal.
The extent of the breakout move can be estimated by measuring from the top of the middle peak down to the neckline. This target is then projected downwards from the point of breakout.
Volume Confirmation
-
High volume on the first peak,
-
Moderate volume on the middle peak,
-
Low volume on the third peak, and
-
A sharp increase in volume on the break below the neckline.
Trading Signals
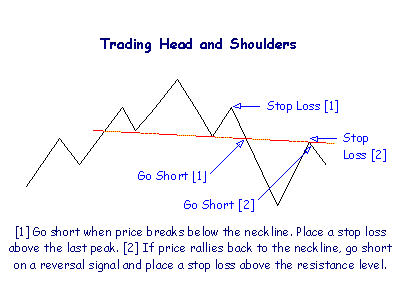
Go short at breakout below the neckline.
Place a stop-loss just above the last peak.
After the breakout, price often rallies back to the neckline which then acts as a resistance level. Go short on a reversal signal and place a stop-loss one tick above the resistance level.
Never trust a head and shoulders pattern where the neckline is clearly ascending (the second trough being higher than the first). Also, the more level the neckline, the more reliable the pattern.
Inverted Head and Shoulders Pattern
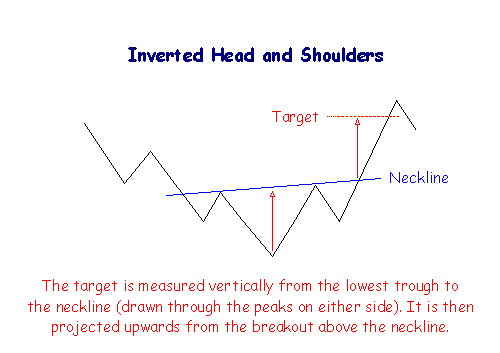
With inverted head and shoulders the neckline is drawn through the highest points of the two intervening peaks. A downward sloping neckline signals continuing weakness and is less reliable as a reversal signal.
The extent of the breakout move can be estimated by measuring from the top of the middle trough up to the neckline. This target is then projected upwards from the point of breakout.
Volume Confirmation
High volume on the first trough,
Moderate volume on the second trough,
High volume on the second peak,
Low volume on the third trough, and
A sharp increase in volume at the breakout.
Trading Signals
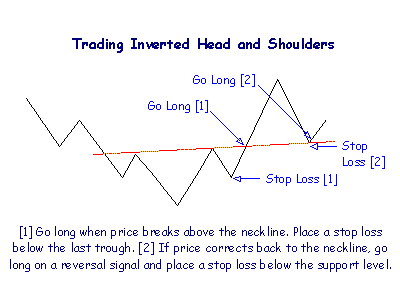
Go long at breakout above the neckline.
Place a stop-loss one tick below the last trough.
There is frequently a correction back to the neckline, which then acts as a support level. Go long on a reversal signal and place a stop-loss one tick below the support level.
Never trust an inverted head and shoulders pattern where the neckline is clearly descending (the second peak being lower than the first). The more level the neckline, the more reliable the pattern.

Author: Colin Twiggs is a former investment banker with almost 40 years of experience in financial markets. He co-founded Incredible Charts and writes the popular Trading Diary and Patient Investor newsletters.
Using a top-down approach, Colin identifies key macro trends in the global economy before evaluating selected opportunities using a combination of fundamental and technical analysis.
Focusing on interest rates and financial market liquidity as primary drivers of the economic cycle, he warned of the 2008/2009 and 2020 bear markets well ahead of actual events.
He founded PVT Capital (AFSL No. 546090) in May 2023, which offers investment strategy and advice to wholesale clients.