Point and Figure
Chart Patterns - Bull and Bear Traps
One of the most reliable chart patterns.
Bull Traps
Bull traps occur when an upward breakout retreats back below a resistance level. Resistance is normally associated with two/more equal highs or an earlier major high.
- Bull traps should be traded in a down-trend.
- They may also signal reversal after an extended up-trend.
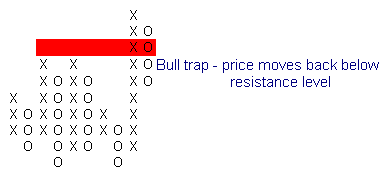
Go short when price falls back below the resistance level.
Bear Traps
Bear traps occur when a downward breakout retreats back above a support level. Support is normally associated with two/more equal lows or an earlier major low.
- Bear traps should be traded in an up-trend.
- They may also signal reversal after an extended down-trend.
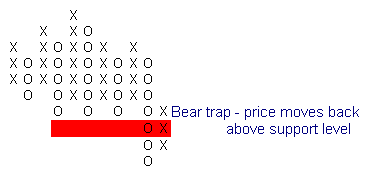
Go long when price rises above the support level.
Wide Bull and Bear Traps
Bull and bear traps (and false breaks) often
occur in longer time frames as well.
Ford Motor Co. displays a bull trap that took
more than a year to complete:
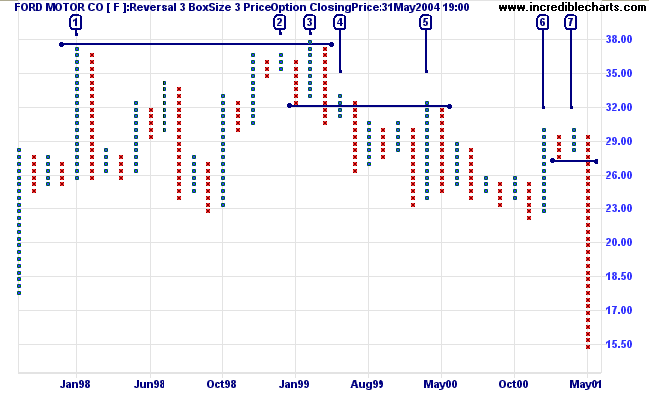
- Price spiked up to a new high, in early 1998, but quickly retraces.
- Resistance forms just below the previous high. The strong following correction is a bearish sign.
- Bull trap: Price rallies to a marginal new high but then retreats below the new support level.
- A short retracement confirms the trend change.
- An equal lower high confirms resistance has formed at 32.00: the low before [3]. A strong bear signal.
- Another attempted rally peters out.
- Equal highs in a down-trend are a strong bear signal; and are followed by a long downward spike.

Author: Colin Twiggs is a former investment banker with almost 40 years of experience in financial markets. He co-founded Incredible Charts and writes the popular Trading Diary and Patient Investor newsletters.
Using a top-down approach, Colin identifies key macro trends in the global economy before evaluating selected opportunities using a combination of fundamental and technical analysis.
Focusing on interest rates and financial market liquidity as primary drivers of the economic cycle, he warned of the 2008/2009 and 2020 bear markets well ahead of actual events.
He founded PVT Capital (AFSL No. 546090) in May 2023, which offers investment strategy and advice to wholesale clients.