Cycles
Many people seem to think that the change in prices in any one day is complete in itself and bears no relation to larger movements which may be under way. This is not so. (Nelson, 1903)
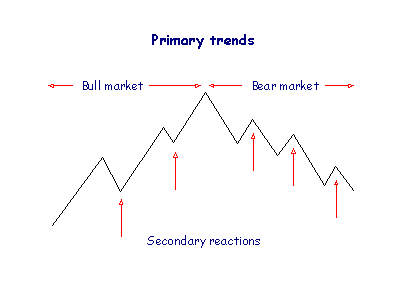
Dow identified 3 major cycles:
- Daily, or minor, movements last from a few hours up to three weeks;
- Secondary reactions normally retrace one third to two thirds of the primary trend (since the previous reaction) and last from 3 weeks to 3 months; and
- Primary movements of the market may last several years.
A number of other cycles have subsequently been identified within these categories:
- The business cycle (periods of expansion and recession) which varies
roughly in line with the primary trend;
- The 4 year presidential cycle: the ruling party generally inflates the economy in the run up to elections, followed by a subsequent contraction at the start of a new term;
- Seasons: stocks generally perform better in Spring and Summer than in Fall or Winter;
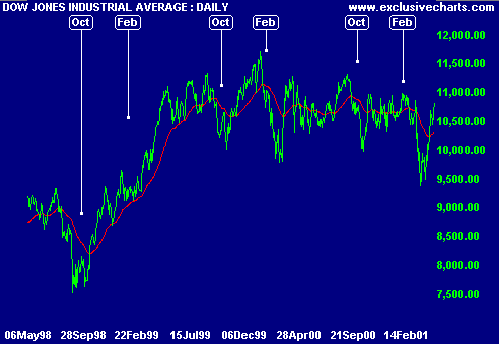
- Calendar months: January, April and November are historically good months to hold stocks; February, May and October are poor months. Take a look at the performance of the Dow during October and February over the last 3 years;
- End-of-the-quarter window dressing: portfolio
managers sell non-performing stocks that
they don't want to show on their end-of-the-quarter books;
- Tax-loss selling in October: professional money managers sell non-performing stocks, creating losses to offset capital gains as they come to the close of their fiscal year;
- Triple witching hour: contracts for stock index futures, stock index options and stock options simultaneously expire on the third Friday of March, June, September and December: The last hour of trading is highly volatile as traders attempt to close their positions;
- The last day of the month and the first 3 days of the new month historically yield higher returns;
- Monday is often the worst, and Friday the best, day of the week for investors - possibly due to short traders closing their positions; and
- Similarly, the last half-hour of any day often experiences price surges as short traders attempt to close out their daily positions.
Sometimes cycles overlap to create larger than normal fluctuations and at other times they offset to create flat periods with little movement. The objective of chart analysis is to identify and predict those cycles which have a dominant effect in a particular time frame.

Author: Colin Twiggs is a former investment banker with almost 40 years of experience in financial markets. He co-founded Incredible Charts and writes the popular Trading Diary and Patient Investor newsletters.
Using a top-down approach, Colin identifies key macro trends in the global economy before evaluating selected opportunities using a combination of fundamental and technical analysis.
Focusing on interest rates and financial market liquidity as primary drivers of the economic cycle, he warned of the 2008/2009 and 2020 bear markets well ahead of actual events.
He founded PVT Capital (AFSL No. 546090) in May 2023, which offers investment strategy and advice to wholesale clients.