Market Tops & Bottoms
William J. O'Neil identifies these market turning points in 24 Essential Lessons for Investment Success.
Market Tops
Look for the following signs on a market index:
- Four or more distribution days,
- Within the space of 2 weeks.
The market index could be the Dow Jones Industrial Average or a local index like the Australian All Ordinaries.
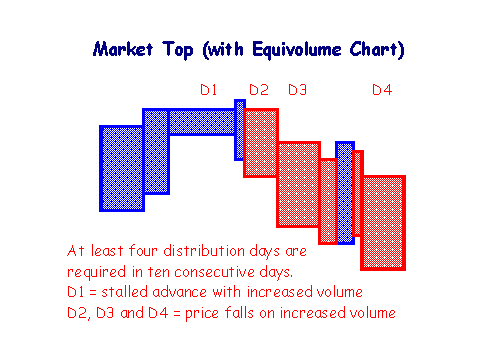
Distribution Days
A Distribution day is where volume increases compared to the previous day and either:
- Closing price moves lower, or
- After trending upwards, the advance stalls and there is little or no increase in closing price.
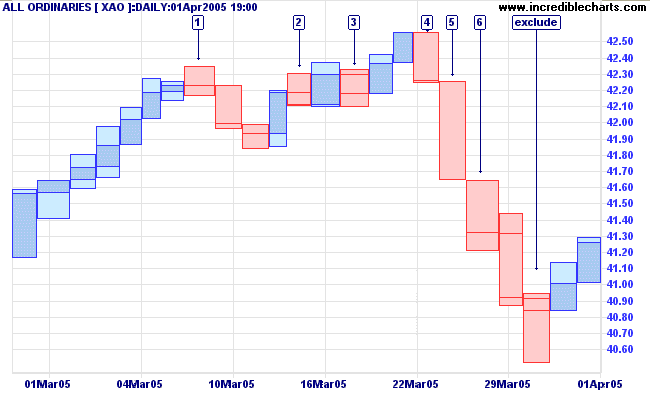
I would add one further qualification: exclude any day that has a long tail - where closing price is in the top half of the day's range. The example below shows a potential market top for the All Ordinaries (ASX). Exclude the last day indicated. Price closed in the top half of the equivolume bar, suggesting an influx of buyers rather than sustained selling pressure.
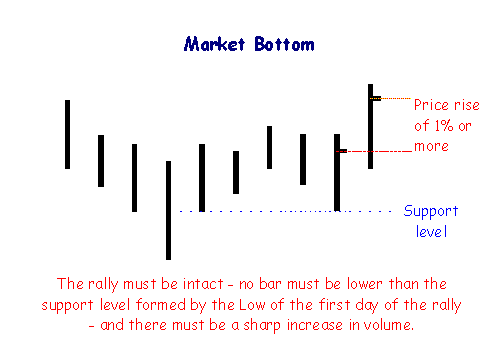
Market Bottoms
Bear markets are interrupted by secondary rallies which, generally, retrace one-third to two-thirds of the decline since the last rally. One of these rallies will eventually follow through and commence a new bull trend.
Follow-Through Days
Look for a day where the index closes at least 1% higher than the previous day and there is a marked increase in volume. This normally occurs between the fourth and seventh days of a rally.
A follow-through day that appears after the seventh day of a rally is a weaker signal.

Author: Colin Twiggs is a former investment banker with almost 40 years of experience in financial markets. He co-founded Incredible Charts and writes the popular Trading Diary and Patient Investor newsletters.
Using a top-down approach, Colin identifies key macro trends in the global economy before evaluating selected opportunities using a combination of fundamental and technical analysis.
Focusing on interest rates and financial market liquidity as primary drivers of the economic cycle, he warned of the 2008/2009 and 2020 bear markets well ahead of actual events.
He founded PVT Capital (AFSL No. 546090) in May 2023, which offers investment strategy and advice to wholesale clients.