Williams %R
Williams %R was developed by Larry Williams to indicate overbought and oversold levels. The indicator is very similar to Stochastic %K - except that Williams %R is plotted using negative values ranging from 0 to -100.
The number of periods used to calculate Williams %R can be varied according to the time frame that you are trading. A rule of thumb is that the indicator window should be half the length of the cycle (14 days is popular for the intermediate cycle).
Overbought and Oversold levels are normally set at -20 and -80.
Trading Signals
Ranging Markets
Use trailing buy- and sell-stops, to enter and exit trades, and protect yourself with stop-losses.
Long signals:
- Go long on bullish divergence or failure swing;
- Go long when Williams %R falls below the oversold level.
Short signals:
- Go short on bearish divergence or failure swing;
- Go short when Williams %R rises above the overbought level.
Example 1
Johnson and Johnson is displayed with 7 day Williams %R.
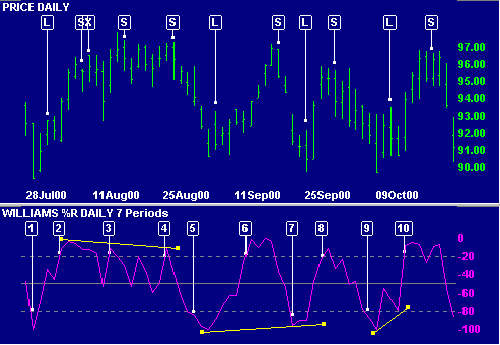
Mouse over chart captions to display trading signals.
- Place a trailing buy-stop when Williams %R falls below the oversold line. We are stopped in [L] when price rises above the previous day's High. Protect your position with a stop-loss below the recent Low.
- Place a trailing sell-stop when %R rises above the overbought line. We are stopped in [S] when price falls below yesterday's Low. The position is stopped out [X] on the following day when price rises above the recent High.
- %R rises above the overbought level. Place a trailing sell-stop. A bearish divergence supports the signal.
- A triple divergence adds further support for the short position.
- Place a trailing buy-stop when %R falls below -80. When stopped in [L], place a stop-loss below the recent Low.
- Place a trailing sell-stop when %R rises above -20. When stopped in [S], place a stop-loss above the recent High.
- Place a trailing buy-stop: the oversold signal is strengthened by a bullish divergence.
- Place a trailing sell-stop.
- %R falls below the oversold level: place a trailing buy-stop. A failure swing is completed when %R rises above the level of the intervening peak.
- Another signal to go short. Place a trailing sell-stop. We are stopped in 5 days later when price falls below the previous day's Low. Protect your position with a stop-loss above the recent High.
Trending Markets
It is advisable to use a longer Williams %R period or some other form of smoothing to reduce volatility and false signals.
Signals should only be taken when there is clear evidence that the trend has reversed. One method of doing so is to wait until %R crosses the -50 level:
- Go long when %R falls below the Oversold level then rises above -50.
- Go short when %R rises above the Overbought level then falls below -50.
Alternatively, use a trend indicator for trend direction and exit signals.
Example 2
Johnson and Johnson with 30 day exponential moving average (MA) and 14 day Williams %R: The chart shows a fairly strong up-trend, suitable for trading with %R trend signals.
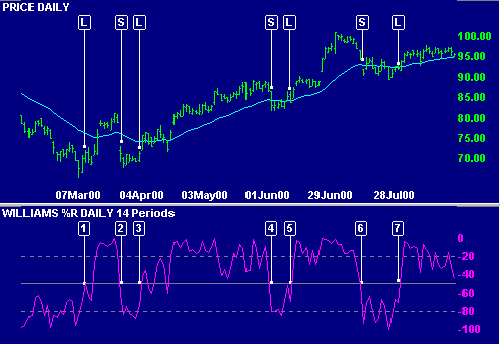
Mouse over chart captions to display trading signals.
- Go long [L]: Williams %R rises from the oversold level to above -50.
- Go short [S] when %R falls below -50 from the overbought level.
- Go long [L] when %R rises above -50 from the oversold level.
- Go short [S]
- Go long [L]
- Go short [S]
- Go long [L]
Note that we are whipsawed fairly frequently if MA is used as the trend indicator, even with closing price as a filter.
Setup
The default Williams %R window is 14 days, with overbought/oversold levels of -20% and -80% respectively. To alter the default settings - Edit Indicator Settings.
See Indicator Panel for directions on how to set up an indicator.
Formula
- The first step is to decide on the number of periods (%R Periods) to be included in the calculation. This can be varied between 5 and 21 days, based on the time frame that you are analyzing.
- Calculate %R, by comparing the latest Closing price to the range traded
over the selected period:
HC = Highest High [in %R Periods] - Close [today]
HL = Highest High [in %R Periods] - Lowest Low [in %R Periods]
%R = HC / HL * -100
The formula is similar to Stochastic %K,
the difference being that CL is used in place of HC above.
CL = Close [today] - Lowest Low [in %K Periods]

Author: Colin Twiggs is a former investment banker with almost 40 years of experience in financial markets. He co-founded Incredible Charts and writes the popular Trading Diary and Patient Investor newsletters.
Using a top-down approach, Colin identifies key macro trends in the global economy before evaluating selected opportunities using a combination of fundamental and technical analysis.
Focusing on interest rates and financial market liquidity as primary drivers of the economic cycle, he warned of the 2008/2009 and 2020 bear markets well ahead of actual events.
He founded PVT Capital (AFSL No. 546090) in May 2023, which offers investment strategy and advice to wholesale clients.