Parabolic SAR
Parabolic SAR was developed by J. Welles Wilder Jr. and is described in his book New Concepts in Technical Trading Systems. SAR stands for stop and reverse.
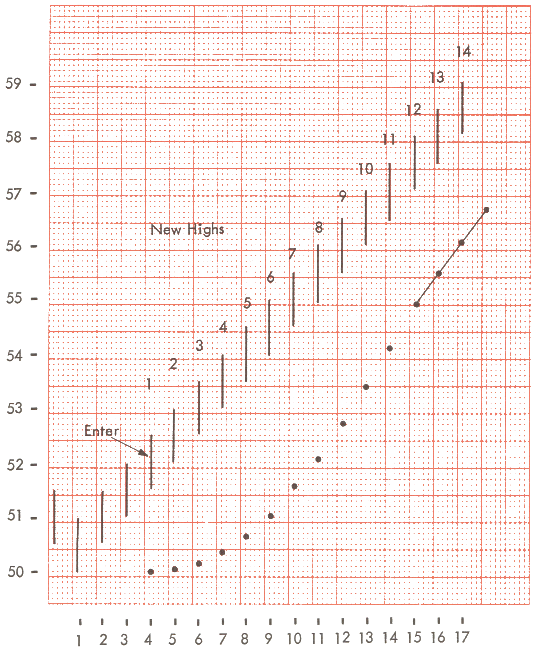
Parabolic SAR should only be employed in trending markets - when it provides useful entry and exit points. It is plotted in a rather unorthodox fashion: a stop loss is calculated for each day using the previous days data. The advantage is that the stop level can be calculated in advance of the market opening.
- A stop level below the current price indicates that your position is long. The stop will move up every day until activated (when price falls to the stop level).
- A stop level above the current price indicates that your position is short. The stop moves down every day until triggered (when price rises to the stop level).
The SAR stop loss is plotted one day ahead, so that the stop will be activated if actual trading prices rise/fall above/below the stop, as this image from Welles Wilder's book illustrates.
Parabolic SAR: Trading Signals
Your first step is to confirm that the market is trending:
- Use a trend indicator, or
- Stop trading with the Parabolic SAR if you are whipsawed twice in a row and re-commence after you observe a breakout from the chart pattern.
A trade is signaled when the price bars and stop levels intersect:
- Go long when price meets the Parabolic SAR stop level, while short.
- Go short when price meets the Parabolic SAR stop level, while long.
Example
Microsoft Corporation plotted with Parabolic SAR and 63-day exponential moving average.
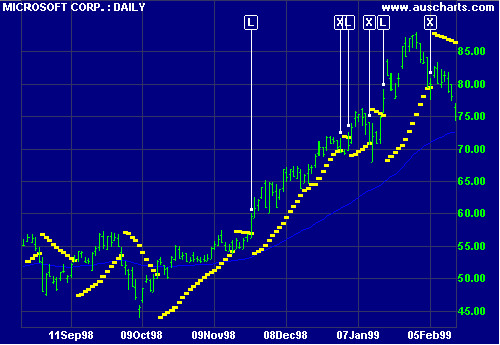
Mouse over chart captions to display trading signals.
- Ignore signals while price is ranging (identified by the fluctuations around the MA). Go long at [L] after price respects the MA. Price then breaks out of the range, confirming our signal.
- Exit [X] when price activates the Parabolic SAR stop.
Do not go short as the MA slopes upwards. - Go long [L] when price crosses back above the stop. MA is still rising.
- Exit [X] when price falls to the stop level.
Do not go short as the MA slopes upwards. - Go long [L] when price crosses back above the stop. MA is still rising.
- Exit [X] when price falls to the stop level.
Do not go short as the MA still slopes upwards.
In the original system, short signals are taken at each exit point [X], resulting in unprofitable trades against the trend.
Setup
See Indicator Panel for directions on how to set up Parabolic SAR on the price chart. The default settings are an acceleration factor of 2% and a maximum step of 20%. To alter the default settings - see Edit Indicator Settings.
Evaluation
Parabolic SAR introduces some excellent concepts to technical analysis but leaves two major weaknesses:
- Trend speeds vary over time and between stocks. It is difficult to arrive at one acceleration factor that suits all trends -- it will be too slow for some and too fast for others.
- The SAR system assumes that the trend changes every time a stop has been hit. Any trader will tell you that your stops may be hit several times while the trend continues. Price merely retraces through your stop and then resumes the up-trend, leaving you lagging behind.
Parabolic SAR Formula
There are a few basic concepts that need to be addressed before we can explain how Parabolic SAR is calculated:
Extreme Point
This is the highest price recorded (to date) during a long trade or the lowest price recorded (to date) during a short trade.
Significant Point
The SP is the highest price reached in a long trade or the lowest price reached in a short trade. It is equal to the extreme point when a trade is closed.
Acceleration Factor
The Acceleration Factor starts at 2% for a new trade and increases by 2% on each day that a new extreme point is reached. The maximum acceleration factor is 20%. No further increases are made after this figure has been reached.
Parabolic SAR Calculation
- On day 1 of a new trade (the day that the trade is entered), the
Parabolic SAR is taken as the significant
point from the previous trade.
If the trade is Long the SP will be the extreme Low reached in the previous trade.
If the trade is Short then the SP will be the extreme High reached in the previous trade. - To calculate Parabolic SAR for the
following day:
Take the difference between the extreme point and the SAR (on day 1) and multiply by the acceleration factor.
If the trade is Long, add the result to the SAR on day 1.
If the trade is Short, subtract the result from the SAR on day 1. - There is one exception:
Parabolic SAR is never moved within the range of the current or previous day (highest High to lowest Low over the 2 days).
If this occurs in a long trade, use the lowest Low over the 2 days as SAR for the following day.
If short, use the highest High over the 2 days as SAR for the following day. - Repeat the Parabolic SAR calculation for each subsequent day, adjusting the Acceleration Factor whenever a new extreme point is recorded.
- The trade is reversed when price equals the Parabolic SAR for the day.

Author: Colin Twiggs is a former investment banker with almost 40 years of experience in financial markets. He co-founded Incredible Charts and writes the popular Trading Diary and Patient Investor newsletters.
Using a top-down approach, Colin identifies key macro trends in the global economy before evaluating selected opportunities using a combination of fundamental and technical analysis.
Focusing on interest rates and financial market liquidity as primary drivers of the economic cycle, he warned of the 2008/2009 and 2020 bear markets well ahead of actual events.
He founded PVT Capital (AFSL No. 546090) in May 2023, which offers investment strategy and advice to wholesale clients.