Equivolume
Volume plays an important role in confirming price movements. It is sometimes difficult to track this relationship on a normal bar chart with volume plotted in a separate slot below. This is overcome by plotting price and volume activity on a single chart.
Equivolume was invented by Richard W Arms Jr. and introduced in his book Volume Cycles in the Stock Market.
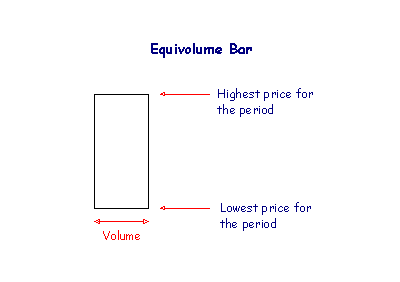
The height of each bar (or box) represents the trading range for the period - the highest and lowest prices recorded - while the width of the bar represents volume traded during the period.
We can tell a great deal about the commitment of buyers and sellers from the shape of the box.
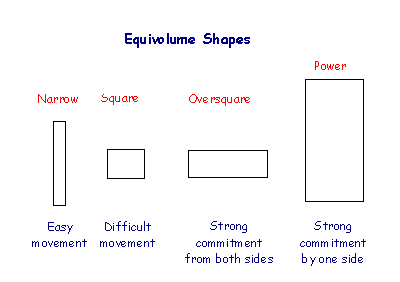
An oversquare day shows that buyers and sellers are both strongly committed to their positions. This is a powerful reversal signal after a strong trend. Power days show strong commitment by buyers in an up-trend (or sellers in a down-trend) and serve as confirmation of breakouts above resistance levels (or below support levels) in a chart pattern.
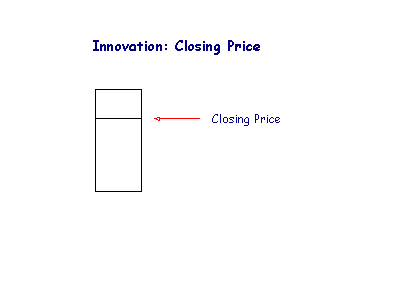
Closing Prices
Incredible Charts have added closing prices to Equivolume charts. The position of closing price in relation to the day's range indicates whether buyers or sellers have control.
In an up-trend:
- A close near to the day's high indicates that buyers have retained control
- Close near the day's low shows that sellers have taken control.
In a down-trend:
- Close near to the day's low indicates that sellers are still incontrol
- Close near to the day's high shows that buyers outweigh sellers.
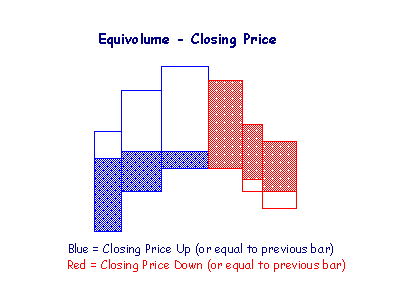
Closing price is represented by a horizontal line across the bar.
So what's the big deal?
The key is that we have shaded the area above or below the closing price, depending on whether the close is higher or lower than the previous day.
This enables you to tell at a glance whether a trend is strong or weakening.
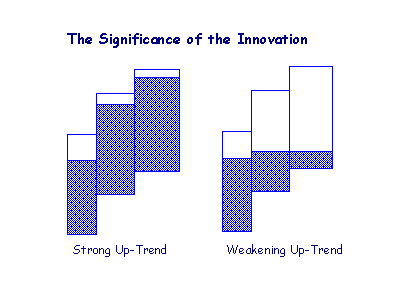
Bars that are mostly lighter shade signal that a trend is weakening.
- If closing price is higher than yesterday's close, the bar will be colored blue/green.
The area below closing price is shaded darker than the area above the close. - If closing price is lower than the previous close, the bar is colored red.
The area above closing price is shaded darker than the area below the close.
So closing price is always the top border of the blue shaded area (green is used on some charts) or the bottom border of the red shaded area (in a down-trend). It sounds complicated but is easy to follow on the chart. Take a look at the figure below.
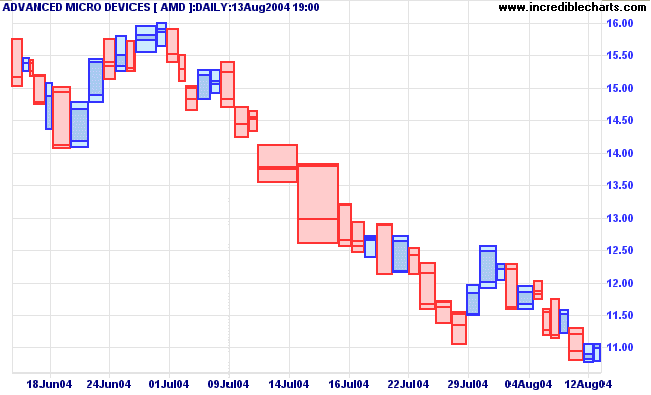
- You can see the trend weakening on the 2nd and 3rd bars - they are mostly lighter shade.
- On the 4th bar there is a lower high and the close is lower - signs that the trend is uncertain.
- The 5th bar signals the start of a down trend and is confirmed by the 6th bar.
Opening Price
At the request of a number of users, Incredible Charts has added Opening Price to equivolume bars. The default format now displays Open, High, Low and Close; similar to candlestick bars. The only difference is that the width of the bar depicts volume, and shadows are depicted by a lighter color shade. Take a look at the AMD chart below:
Select View >> Line / Bar Types >> Line / Bar Options >> Display Equivolume HLC to revert to the old format (without the opening price).
Colors
Default bar colors are:
- Blue if the Close is higher than the Open (or green depending on your color scheme);
- Red if the Open is higher than the Close; and
- Same as the previous bar if the Open and Close are equal.
In the old format (without the opening price), equivolume bars are colored:
- Blue if today's close is higher than yesterday's close;
- Red if yesterday's close is higher than today's close; and
- Same as the previous bar if today's close is equal to yesterday's close.
See Bar Colors for details on how to change these colors.

Author: Colin Twiggs is a former investment banker with almost 40 years of experience in financial markets. He co-founded Incredible Charts and writes the popular Trading Diary and Patient Investor newsletters.
Using a top-down approach, Colin identifies key macro trends in the global economy before evaluating selected opportunities using a combination of fundamental and technical analysis.
Focusing on interest rates and financial market liquidity as primary drivers of the economic cycle, he warned of the 2008/2009 and 2020 bear markets well ahead of actual events.
He founded PVT Capital (AFSL No. 546090) in May 2023, which offers investment strategy and advice to wholesale clients.