Rate of Change (Price)
ROC is a refinement of Momentum - readings fluctuate as percentages around the zero line.
The indicator is designed for use in ranging markets - to detect trend weakness and likely reversal points. However, when combined with a trend indicator, it can be used in trending markets.
Trading Signals
ROC trading signals are identical to Momentum signals.
Ranging Markets
First, you will need to set overbought and oversold levels based on your observation of past ranging markets. The levels should cut across at least two-thirds of the peaks and troughs.
- Go long when ROC crosses to below the oversold level and then rises back above it.
- Go long on bullish divergences - where the first trough is below the oversold level.
- Go short when ROC crosses to above the overbought level and then falls back below it.
- Go short on a bearish divergence - with the first peak above the overbought level.
Example 1
FedEx is plotted with 10 day ROC indicator and 21 day exponential moving average.
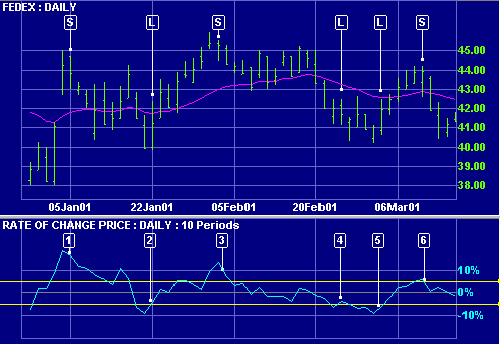
Mouse over chart captions to display trading signals.
- Go short [S] when ROC turns down above the overbought level. Place a stop-loss above the recent High.
- Go long [L] when ROC turns up from below the oversold level. Place a stop below the latest Low.
- Go short [S].
- Go long [L]. This proves a false signal as price falls below the recent Low - stopping out the position.
- Go long [L] when ROC again turns up from below the oversold level.
- Go short [S].
Use stop-losses on all trades.
Trending Markets
First, identify the trend direction using a trend indicator. ROC tends to stay above zero during an up-trend and below zero during a down-trend.
Only take signals in the direction of the trend.
- In an up-trend, go long if ROC turns upwards when below zero.
- In a down-trend, go short if ROC turns downward when above zero.
Use trailing buy and sell stops to time your entry and exit.
Take profits on divergences and trend line breaks.
Exit using a trend indicator.
Trend lines are sometimes drawn on ROC. A break in the trend line often occurs in advance of a similar break on the price chart.
Example 2
General Motors with 10 day ROC and 21 day exponential moving average.
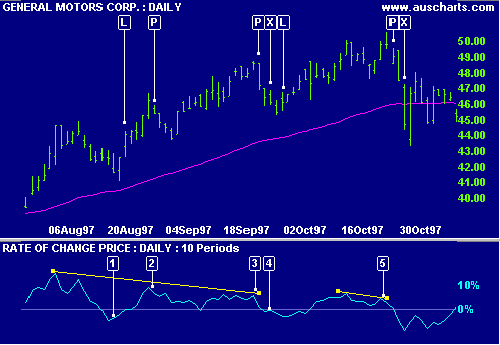
Mouse over chart captions to display trading signals.
- ROC turns up from below zero, providing an excellent first entry point in the trend. Go long [L].
- Take profits [P] on a bearish divergence.
- A triple divergence
occurs - take more profits [P].
Exit [X] when price closes below the MA. - Go long [L] when ROC turns up below zero. Enter when price crosses above the MA and above the High of the signal day.
- Take profits [P] on a bearish divergence.
Exit [X] when price closes below the MA.
Setup
See Indicator Panel for directions on how to set up the ROC indicator. The default indicator window is set at 12 days.
Edit Indicator Settings explains how to alter the default settings.
Formula
Rate of Change is calculated as:
(Close [today] - Close [n days ago]) / Close [n days ago] * 100
This causes the indicator to fluctuate as a percentage around the zero line.
Example
| Day | Closing Price | Close [5 days ago] |
Momentum [5 days] |
ROC [Mom / Close 5 days ago]*100 |
|---|---|---|---|---|
| 1 | 52.00 | - | - | - |
| 2 | 51.00 | - | - | - |
| 3 | 51.50 | - | - | - |
| 4 | 48.50 | - | - | - |
| 5 | 53.00 | - | - | - |
| 6 | 53.50 | 52.00 | 1.50 | 2.89% |
| 7 | 53.50 | 51.00 | 2.50 | 4.90% |
| 8 | 54.00 | 51.50 | 2.50 | 4.85% |
| 9 | 54.00 | 48.50 | 5.50 | 11.34% |
| 10 | 55.00 | 53.00 | 2.00 | 3.77% |