Percentage Bands
Percentage Bands are a simple trend-following system that plots bands at a set percentage above and below the current price. The bands include a ratchet mechanism to ensure that the lower band does not retreat lower during a long trade and the upper band does not rise during a short trade. The system uses similar logic to Percentage Trailing Stops.
Percentage Band Trading Signals
The signals may be used for entries and exits. In an up-trend:
- Go Long when price closes above the upper band.
- Exit the long position when price closes below the lower band.
In a down-trend:
- Go Short when price closes below the lower band.
- Exit the short position when price closes above the upper band.
Examples
Nymex Light Crude (CL) down-trend 2014 to 2016 plotted with Percentage Bands at 10% and 500-day Linear Regression as a trend indicator.
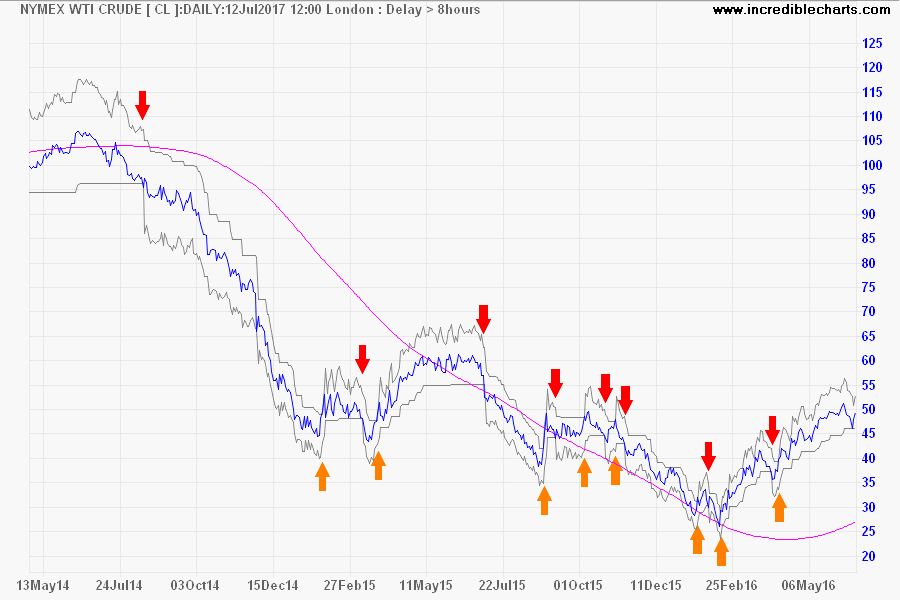
- Go short [red down arrow] when price closes below the Lower band and Linear Regression line is sloping down.
- Exit [orange up arrow] when price closes above the upper band.
Visa (V) up-trend 2011 to 2014 plotted with Percentage Bands at 10% and 500-day Linear Regression as a trend indicator.
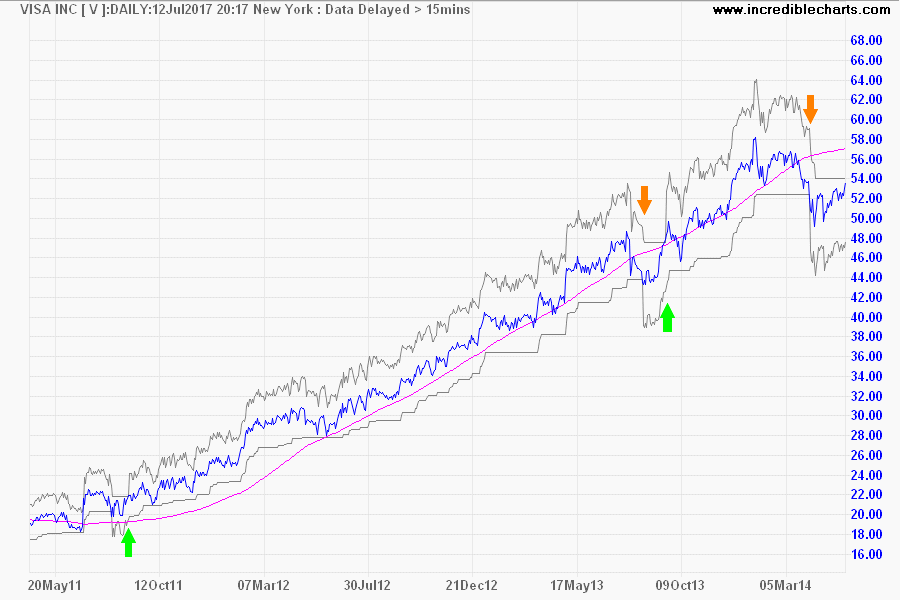
- Go long [green up arrow] when price closes above the upper band and Linear Regression line is sloping up.
- Exit [orange down arrow] when price closes below the lower band.
Setup
The default is set as 10 percent.
Closing Price is set as the default option. The alternative is High/Low (see Formula below).
See Indicator Panel for directions on how to set up an indicator — and Edit Indicator Settings to change the settings.
Percentage Bands Formula
Percentage Bands are normally calculated using closing prices:
- Add and subtract the selected percent (normally 10%) from the Closing Price and plot the result as the band for the following day
- There is also built in a ratchet mechanism so that the lower band does not move lower during a Long trade nor rise during a Short trade.
If you select the High/Low option, the bands are calculated from the High and Low prices rather than the Close:
- The lower band is calculated by subtracting the selected percent (normally 10%) from the High.
- The upper band is calculated by adding the selected percent (normally 10%) to the Low.
Evaluation
More volatile stocks require larger percentages whereas bands using average true range adjust as volatility increases.

Author: Colin Twiggs is a former investment banker with almost 40 years of experience in financial markets. He co-founded Incredible Charts and writes the popular Trading Diary and Patient Investor newsletters.
Using a top-down approach, Colin identifies key macro trends in the global economy before evaluating selected opportunities using a combination of fundamental and technical analysis.
Focusing on interest rates and financial market liquidity as primary drivers of the economic cycle, he warned of the 2008/2009 and 2020 bear markets well ahead of actual events.
He founded PVT Capital (AFSL No. 546090) in May 2023, which offers investment strategy and advice to wholesale clients.