Chaikin Volatility
Marc Chaikin measures volatility as the trading range between high and low for each period. This does not take trading gaps into account as Average True Range does.
Chaikin Volatility should be used in conjunction with a moving average system or price envelopes.
Chaikin Volatility Trading Signals
Look for sharp increases in volatility prior to market tops and bottoms, followed by low volatility as the market loses interest.
Example
Dow Jones Industrial Average with Chaikin Volatility and Price Envelopes at 10% around a 21 day exponential moving average.
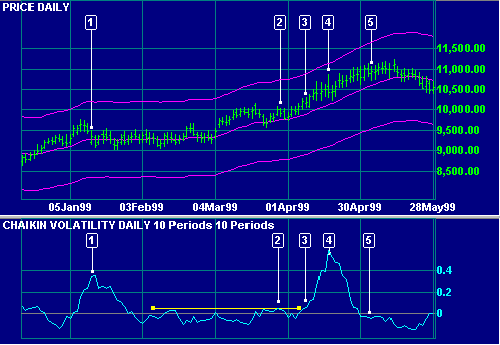
Mouse over chart captions to display trading signals.
- A Chaikin Volatility peak occurs as the market retreats from a new high and enters a trading range.
- The market ranges in a narrow band - note the low volatility.
The breakout from the range is not accompanied by a significant rise in volatility. - Volatility starts to rise as price rises above the recent high.
- A sharp rise in volatility occurs prior to a new market peak.
- The sharp decline in volatility signals that the market has lost impetus and a reversal is likely.
Setup
See Indicator Panel for directions on how to set up Chaikin Volatility. The default settings are:
- H-L period of 10 days
- Volatility smoothing - 10 days
To alter the default settings - see Edit Indicator Settings.
Chaikin Volatility Formula
To calculate Chaikin Volatility:
First, calculate an exponential moving average (normally 10 days) of the difference between High and Low for each period:
EMA [H-L]
Next, calculate the percentage change in the moving average over a further period (normally 10 days):
( EMA [H-L] - EMA [H-L 10 days ago] ) / EMA [ H-L 10 days ago] * 100

Author: Colin Twiggs is a former investment banker with almost 40 years of experience in financial markets. He co-founded Incredible Charts and writes the popular Trading Diary and Patient Investor newsletters.
Using a top-down approach, Colin identifies key macro trends in the global economy before evaluating selected opportunities using a combination of fundamental and technical analysis.
Focusing on interest rates and financial market liquidity as primary drivers of the economic cycle, he warned of the 2008/2009 and 2020 bear markets well ahead of actual events.
He founded PVT Capital (AFSL No. 546090) in May 2023, which offers investment strategy and advice to wholesale clients.