Price Envelopes
Price envelopes (or percentage bands) are plotted at a set percentage above and below a moving average. They are used to indicate overbought and oversold levels and can be traded on their own or in conjunction with a momentum indicator.
The length of the moving average should be varied according to the cycle that you are trading. See Moving Averages for details.
The Percentage should be set so that about 90% of price activity is contained within the bands. Adjust the band width if volatility increases over time.
Trading Signals
First, identify whether price is trending or ranging:
- When price swings back and forth across the moving average it is ranging.
- When price stays above the moving average it is in an up-trend.
- When price stays below the moving average it is trending down.
Ranging Market
The theory is that a movement that starts at one price band is likely to carry to the other, though this is not entirely reliable. Stop losses should be placed below the most recent low when you go long or above the latest high if you go short.
- Go long when prices turn up near the lower band.
Close your position if price turns down near the upper band or if it crosses back below the moving average (from above).
- Go short when price turns down near the upper band.
Close your position if price turns up near the lower band or crosses back above the moving average (from below).
Use reversal signals to detect turning points close to the upper and lower bands.
Closing price is often used as a filter with the moving average. Trailing buy- and sell-stops can be used to time entry and exit points.
Example 1
IBM is charted with Percentage bands at 7% around a 30 day exponential moving average.
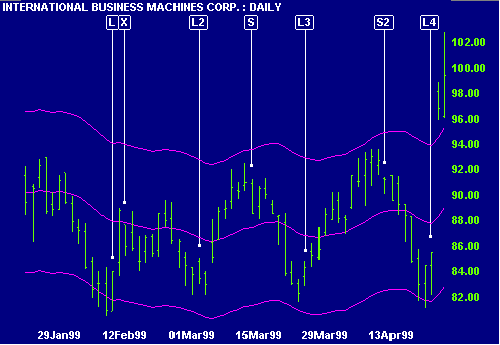
Mouse over chart captions to display trading signals.
- Go long [L] - there is a hook reversal when price is near the lower band.
- Exit [X] the long position when price closes back below the moving average.
- Go long again [L2] when price turns up near the lower band.
- Go short [S] when price turns down near the upper band.
- Continue with this pattern until price begins to trend (indicated by the breakout from the trading range) then switch to the signals below.
Trending Market
When price is in a trend it does not cross from one band to the other, but tends to stay above the moving average in an up-trend (or below in a down-trend).
- In an up-trend: Go long when a price correction respects the moving average (price turns down from the upper band and then turns back up when still above the MA).
Close your position when price returns to the upper band or crosses to below the moving average.
- In a down-trend: Go short when a rally holds below the moving average, after price turns up from the lower band.
Exit when price returns to the lower band or crosses to above the moving average.
When going long - set stop losses below the most recent low. When going short - set them above the latest high.
Closing price is often used as a filter.
Example 2
The above chart of IBM is continued but with Percentage bands at 12% around a 30 day exponential moving average.
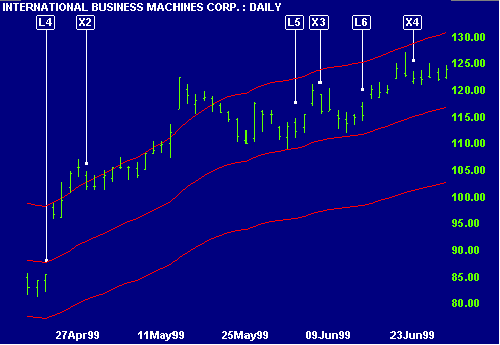
Mouse over chart captions to display trading signals.
- The first long signal [L4] is generated while price is still ranging. Switch to trending signals when the next bar breaks above the trading range and adjust the percentage bands to the increased volatility.
- Exit [X2] when price turns down (below the Low of the highest day).
- Go long [L5] when price respects the moving average. Set a stop-loss below the recent minor low.
- Exit [X3] when price turns down near the upper band.
- Go long (when price exceeds the previous days High) at [L6] and exit at [X4].
Setup
See Indicator Panel for directions on how to set up Price Envelopes.
The default bands are set at 5% around a 20 day exponential moving average. To alter the default settings - Edit Indicator Settings.

Author: Colin Twiggs is a former investment banker with almost 40 years of experience in financial markets. He co-founded Incredible Charts and writes the popular Trading Diary and Patient Investor newsletters.
Using a top-down approach, Colin identifies key macro trends in the global economy before evaluating selected opportunities using a combination of fundamental and technical analysis.
Focusing on interest rates and financial market liquidity as primary drivers of the economic cycle, he warned of the 2008/2009 and 2020 bear markets well ahead of actual events.
He founded PVT Capital (AFSL No. 546090) in May 2023, which offers investment strategy and advice to wholesale clients.