Compare Prices
There are several options for comparing prices of two stocks — or a stock relative to an index:
- Price Comparison plots a second stock or index on the price chart. The scale of the second stock or index is adjusted so that both price lines commence at the same point on the left of the chart.
- Price Comparison (Unadjusted) makes no adjustment to the scale.
- Price Comparison (Intercept) adjusts the scale of the second stock or index based on the relationship between the two prices on a selected date.
Strengths & Weaknesses
- The scale of Price Comparison is adjusted each time that you change the time frame — so that the two lines still intercept at the left edge of the chart. This maximizes use of the available chart space, but is impractical if you wish to draw trendlines or captions on the chart.
- Price Comparison (Unadjusted) is ideal for comparing yields or stocks in a similar price range, but would deliver strange results if you had to compare a penny stock to the Dow Industrial Average (10,000)
- Price Comparison (Intercept) is suitable for drawing trendlines and captions provided you do not adjust the intercept date. Users must also remember to select a fairly recent date. If no date is selected, the earliest possible date is used.
Example - Price Comparison
Proctor and Gamble is charted with Price Comparison to Johnson & Johnson.
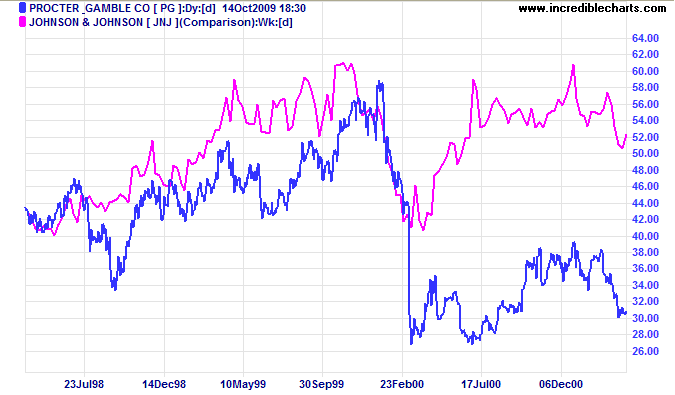
Observe how the two stocks perform relatively evenly over 1999. Both declined for the first two months of 2000 (this was in line with the Dow) before PG's sharp fall in early March after an earnings disappointment.
Example - Intercept
Proctor and Gamble displays Price Comparison (Intercept) with Johnson & Johnson, and an intercept date of 5-Jan-2001.
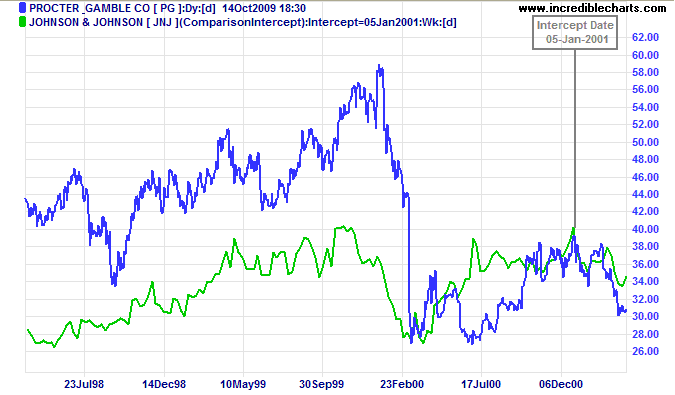
Mouse over chart captions to display trading signals.
Selection of a more recent intercept date enables comparison of relative performance going forward.
Example - Unadjusted
Ten-year and 3-month treasury yields are compared using the same price scale on the chart below.
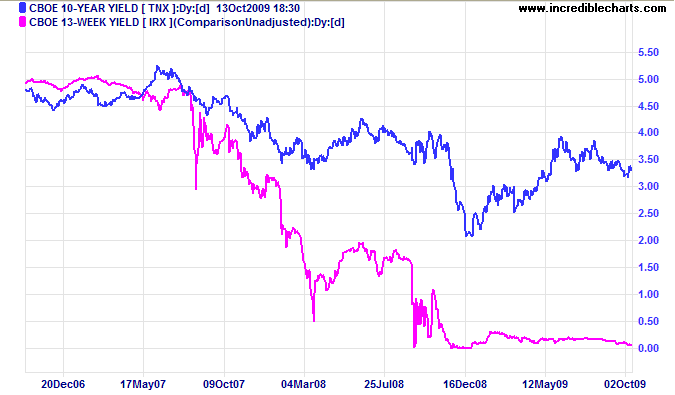
Comparison of two interest rates would be distorted if charted with either of the other Price Comparison options.
Setup
To set up the Price Comparison indicator:
- Open the Indicator Panel
- Select Price Comparison in the left column
- Select the comparative security or index from the drop-down menu
- Select Daily, Weekly or Monthly from the center panel
- Select Apply to Project or Apply to Securityfrom the
center panel.
Apply to Project applies the the indicator to all securities in the current project.
Apply to Security applies the the indicator to the current security only. - Save the settings using ">".
Set up of the Price Comparison (Intercept) indicator is very similar, except that you must remember to select a recent date for the intercept, else the earliest possible date is used.
Formula
The Price Comparison line is calculated using the ratio of closing price to that of another security/index, on the first day of the chart. This means that the starting point of the Price Comparison will vary according to the Time Period selected. The line may appear to move if you change time periods; but the slope remains the same.
Price Comparison (Intercept) performs a similar calculation, but on a selected date. If no date is selected, the earliest possible date is used. If the date selected is not a trading day, the next trading day is taken as the intercept date.

Author: Colin Twiggs is a former investment banker with almost 40 years of experience in financial markets. He co-founded Incredible Charts and writes the popular Trading Diary and Patient Investor newsletters.
Using a top-down approach, Colin identifies key macro trends in the global economy before evaluating selected opportunities using a combination of fundamental and technical analysis.
Focusing on interest rates and financial market liquidity as primary drivers of the economic cycle, he warned of the 2008/2009 and 2020 bear markets well ahead of actual events.
He founded PVT Capital (AFSL No. 546090) in May 2023, which offers investment strategy and advice to wholesale clients.