Chaikin Money Flow
Another popular indicator by Marc Chaikin based on the Accumulation Distribution line. The indicator often warns of breakouts and provides useful trend confirmation.
Chaikin Money Flow is based on the observation that buying support is normally signaled by increased volume and frequent closes in the top half of the daily range. Likewise, selling pressure is evidenced by increased volume and frequent closes in the lower half of the daily range. See Accumulation and Distribution.
Chaikin Money Flow has two weaknesses:
- The indicator does not account for Gaps.
- CMF has a tendency to "bark twice" - as with a simple moving average (unusually high or low data affects the indicator on the day it is added and the day it is dropped from the indicator period).
Twiggs Money Flow addresses these failings.
Chaikin Money Flow Trading Signals
A positive Chaikin Money Flow signals accumulation, while distribution is signaled by the indicator line below zero. The higher the reading (above or below zero), the stronger the signal.
- Go long if a breakout above resistance is supported by Chaikin Money Flow above zero.
- Go short if a breakout below support is confirmed by negative Chaikin Money Flow.
Divergences also provide good signals:
- Go long on a bullish divergence.
- Go short on a bearish divergence.
Example
Flight Centre (Australia) with 30-week Weighted Moving Average and Chaikin Money Flow.
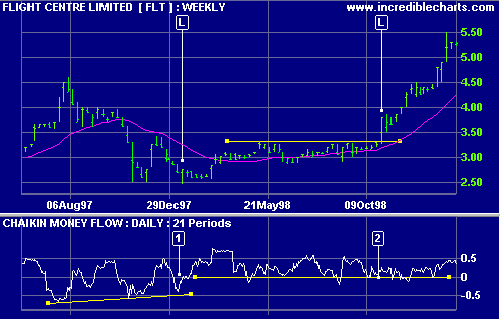
Mouse over chart captions to display trading signals.
- Go long [L] on bullish triple divergence.
- Go long [L] on break above the resistance level. The several months positive Chaikin Money Flow provides excellent warning of the breakout.
Setup
See Indicator Panel for directions on how to set up Chaikin Money Flow. The default settings are:
- 21 days
To alter the default settings - Edit Indicator Settings.
Chaikin Money Flow Formula
Both Twiggs Money Flow and Chaikin Money Flow are based on the Accumulation Distribution indicator.
Marc Chaikin calculates AD using:
- Close minus Low
- High minus Close, and
- High minus Low.
His formula first positions the close in relation to the trading range:
{(Close - Low) - (High - Close)} / {High - Low}
and then calculates AD by multiplying the result by the day's volume:
{(Close - Low) - (High - Close)} / {High - Low} * Volume
The Chaikin Money Flow sums AD for 21 days and then divides the result by volume for the identical period. Volume is used as the divisor so that the indicator will fluctuate between a maximum of 1 and a minimum of -1.
The "barking twice" problem is caused by the straight summation of AD for 21 days - unusual data affects the indicator on the day it is added and again when it is removed (on day 22).

Author: Colin Twiggs is a former investment banker with almost 40 years of experience in financial markets. He co-founded Incredible Charts and writes the popular Trading Diary and Patient Investor newsletters.
Using a top-down approach, Colin identifies key macro trends in the global economy before evaluating selected opportunities using a combination of fundamental and technical analysis.
Focusing on interest rates and financial market liquidity as primary drivers of the economic cycle, he warned of the 2008/2009 and 2020 bear markets well ahead of actual events.
He founded PVT Capital (AFSL No. 546090) in May 2023, which offers investment strategy and advice to wholesale clients.