Indicator Basics: Signals
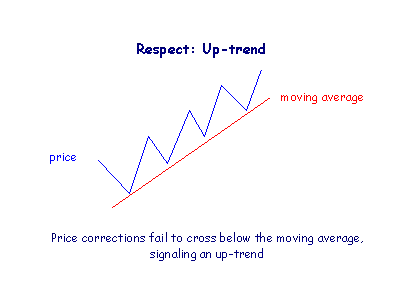
Respect
If price reverses direction when it reaches a moving average (or trend line) we say that price has respected that moving average (or trend line).
This is significant as it confirms that price is trending.
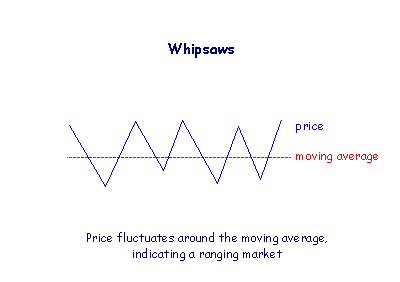
Whipsaws
If price fluctuates around a moving average, frequently crossing above and below, this is referred to as whipsawing.
Price whipsawing around a moving average signals that price is ranging.
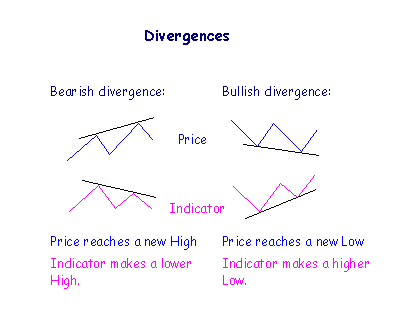
Divergence
Many indicators tend to imitate the peaks and troughs on the price chart with a series of similar highs and lows. Divergence occurs when the indicator fails to imitate the pattern on the price chart, a sign of trend weakness and likely reversal.
In an up-trend, if price makes a new High (a higher peak than the last) but the indicator fails to do so, that is a bearish divergence.
In a down-trend, if price makes a new Low (a lower trough than the last) but the indicator does not, a bullish divergence occurs.
Unless supported by other indicators, ignore weaker divergences where:
- Price makes an equal High (a double top) and the indicator makes a lower High or price makes an equal Low (a double bottom) and the indicator makes a higher Low; or
- Price reaches a new High and the indicator makes an equal High or price reaches a new Low and the indicator makes an equal low; or
- Peaks or troughs are only marginally different in height (if you need a ruler to distinguish which is higher).
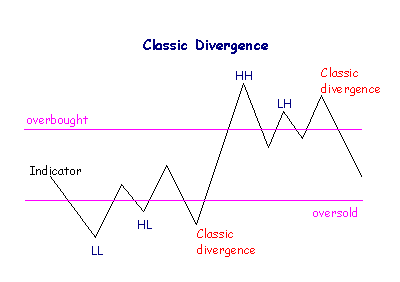
Failure Swings
Failure swings, in overbought or oversold territory, signal that a trend is weakening and likely to reverse. They also add weight to other signals and are identified by either:
- A trough [LL] below the oversold level,
- followed by an intervening peak that does not reach the overbought level,
- then a higher second trough [HL].
- To complete the failure swing the indicator must then rise above the intervening peak.
OR
- A peak [HH] above the overbought level,
- followed by an intervening trough that does not reach the oversold level,
- then a lower second peak [LH].
- To complete the failure swing the indicator must then fall below the intervening trough.
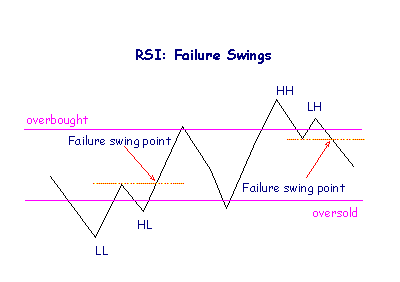
This pattern of highs and lows is identical to a trend reversal on a price chart.
The signal is strongest when the second peak (or trough) is also above the Overbought level (below the Oversold level), though this is not essential for a valid failure swing.
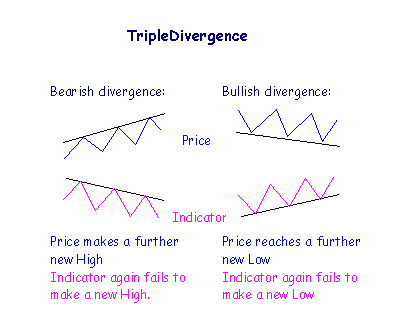
Triple Divergence
A triple divergence only occurs where a divergence has given an incorrect signal. Instead of reversing direction, price has made a new, higher High (in an up-trend) or lower Low (in a down-trend). If the indicator repeats its signal by making another lower High (in an up-trend) or higher Low (in a down-trend), this is an even stronger signal than the original divergence.
Classic Divergence
George Lane (Stochastic indicator) identified a weaker form of triple divergence where the third peak is higher than the second.