Price Comparison
The Price Comparison (or comparative performance) is useful for comparing the performance of one stock relative to another (or to an index).
Price Comparison plots the closing price of a second stock (or index) onto the price chart. The scale of the second stock (or index) is adjusted so that both price lines commence at the same point.
Example
Proctor and Gamble is charted with Closing price, Price comparison to Johnson & Johnson and Price comparison to the Dow Jones Industrial Average.
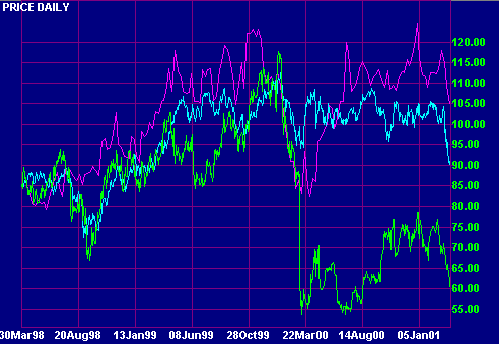
Observe how the two stocks perform relatively evenly over 1999. Both declined over the first two months of 2000 (this was in line with the Dow) before PG's sharp fall in early March - after an earnings disappointment.
Setup
To set up the Price Comparison indicator:
- Open the Indicator Panel
- Select Price Comparison in the left column
- Select the comparative security or index from the drop-down menu
- Select Daily, Weekly or Monthly from the center panel
- Select Apply to Project or Apply to Securityfrom the
center panel.
Apply to Project applies the the indicator to all securities in the current project.
Apply to Security applies the the indicator to the current security only. - Save the settings using ">".
Price Comparison Formula
The Price Comparison line is calculated using the ratio of closing price to that of another security/index, on the first day of the chart. This means that the starting point of the Price Comparison will vary according to the Time Period selected. The line may appear to move if you change time periods; but the slope remains the same.
Tip
Settle on one or two standard time periods to be used when viewing Price Comparison charts (eg. 3 Years - Weekly; 6 Months - Daily).

Author: Colin Twiggs is a former investment banker with almost 40 years of experience in financial markets. He co-founded Incredible Charts and writes the popular Trading Diary and Patient Investor newsletters.
Using a top-down approach, Colin identifies key macro trends in the global economy before evaluating selected opportunities using a combination of fundamental and technical analysis.
Focusing on interest rates and financial market liquidity as primary drivers of the economic cycle, he warned of the 2008/2009 and 2020 bear markets well ahead of actual events.
He founded PVT Capital (AFSL No. 546090) in May 2023, which offers investment strategy and advice to wholesale clients.