Twiggs® Trend Index
Twiggs Trend Index is a proprietary indicator — a variation of the popular Twiggs Money Flow. Results look similar at first glance but there are some subtle differences. Twiggs Trend Index is calculated using Volatility, instead of Volume, which offers two distinct advantages:
- Twiggs Trend Index is not susceptible to large volume spikes that sometimes distort Twiggs Money Flow; and
- Twiggs Trend Index can be plotted on currencies, precious metals, commodities and indices where no volume data is available.
Large Volume Spikes
Here, IPH Ltd [IPH] on the ASX experienced a volume spike, with 32.7 million shares changing hands in a single day compared to the 21-day average of 600,000. Twiggs Money is clearly distorted, signaling strong buying pressure.

Twiggs Trend Index avoids distortion, displaying a short bear market rally while continuing to warn of a down-trend.

No Volume
Here Twiggs Trend Index is plotted on the weekly US Dollar Index [DXY]. No volume is needed.
![Dollar Index [DXY] & Twiggs Trend Index](/images/png_images/dxy-twiggs-trend-index.png "Dollar Index [DXY] & Twiggs Trend Index")
Trading Signals
Trading signals are the same as for Twiggs Money Flow:
Twiggs Trend Index signals accumulation if above zero, while negative values signal distribution. The higher the reading (above or below zero), the stronger the signal.
- Go long if breakout above resistance is supported by Twiggs Trend Index above zero.
- Go short if breakout below support is confirmed by negative Twiggs Trend Index.
Divergences also provide good signals:
- Go long on a bullish divergence.
- Go short on a bearish divergence.
The strongest confirmation of the above signals is when either:
- Twiggs Trend Index is trending upwards and completes a trough above the zero line (i.e. without crossing below zero); or
- Twiggs Trend Index trends downwards and completes a peak without crossing above zero.
Example
One of the best signals I have seen on Twiggs Money Flow is this classic Flight Centre [FLT] breakout, plotted here with 13-week Twiggs Trend Index and 30-week Weighted Moving Average.
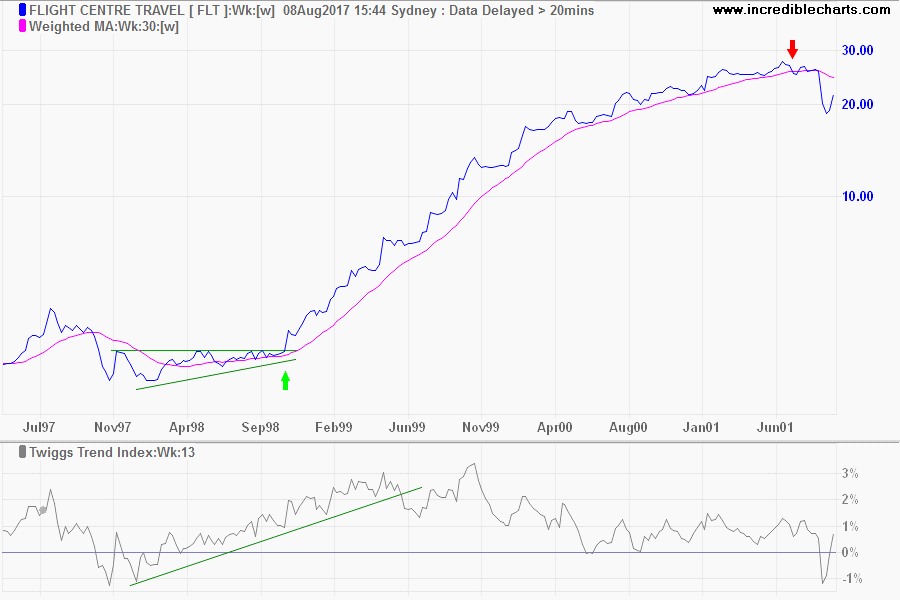
- A large bullish ascending triangle in 1998 warns of a potential breakout.
- Rising Twiggs Trend Index confirms strong buying pressure.
- Go long [green arrow] on breakout above resistance at $3.15.
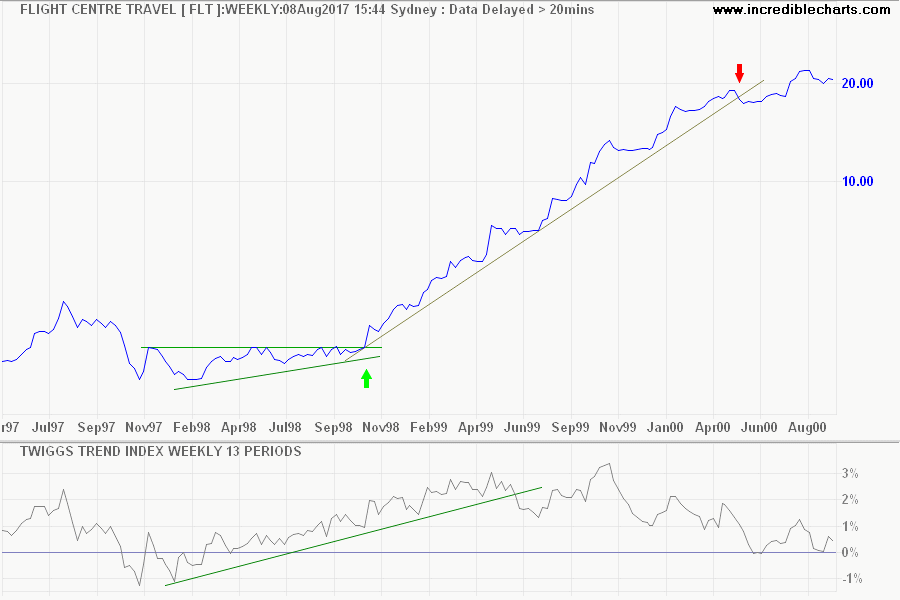
- At the time I used to take exits using Stan Weinstein's 30-week Weighted Moving Average (or Exponential MA) which here provides a great exit signal.
Even if you exit using a trendline as in the chart below — penetration warns that the trend is losing momentum — you would still capture a large portion of the trend.
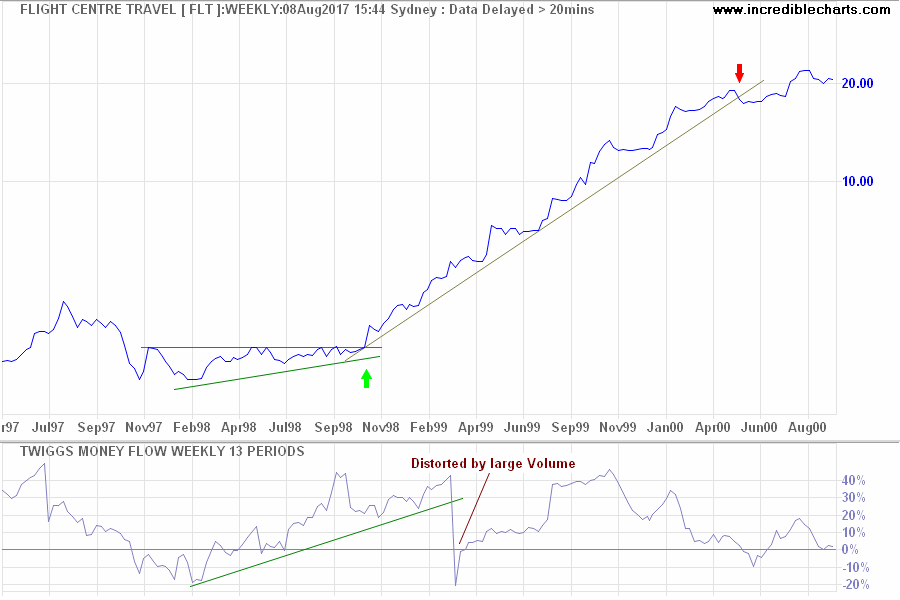
The chart below shows Twiggs Money Flow (13-week) for the same period. Note how indicator values in March 1999 are distorted by another large volume spike.
Twiggs® Trend Index Setup
The default period is set at 21 days but I often use 13 weeks with a longer term weekly chart.
See Indicator Panel for directions on how to set up an indicator — and Edit Indicator Settings to change the settings.
Twiggs® Trend Index Formula
Twiggs Trend Index is a variation on Twiggs Money Flow that uses Volatility instead of Volume. The formula is proprietary and is not disclosed.
Conclusion
A useful substitute for Twiggs Money Flow but best used together with the Money Flow indicator, to provide a more rounded view of market sentiment.

Author: Colin Twiggs is a former investment banker with almost 40 years of experience in financial markets. He co-founded Incredible Charts and writes the popular Trading Diary and Patient Investor newsletters.
Using a top-down approach, Colin identifies key macro trends in the global economy before evaluating selected opportunities using a combination of fundamental and technical analysis.
Focusing on interest rates and financial market liquidity as primary drivers of the economic cycle, he warned of the 2008/2009 and 2020 bear markets well ahead of actual events.
He founded PVT Capital (AFSL No. 546090) in May 2023, which offers investment strategy and advice to wholesale clients.