Free Stock Charts Advanced simplicity
Get the insight you need to stay ahead of the markets with our proprietary suite of indicators and powerful stock screens.
Start with a free plan and upgrade when you’re ready to maximize your potential.
No Credit card required


Free charting includes:
- Advanced stock charting in your browser
- More than 100 Technical Indicators
- Proprietary Indicators designed by Colin Twiggs
- ASX, NYSE, NASDAQ and OTC Markets (15-20min. delayed)
- Forex & Precious Metals (10min. delayed)
- Unlimited indicators, watchlists, and alerts
- Premium data with up to 10 years of history
- Limited to 100 data calls per month
Premium Plans include:
- All free features
- Unlimited Data Calls
- Up to 44 years of premium data history
- Unlimited Stock Screens with a wide array of technical filters
Video Guides


Proprietary Indicators
Proprietary Indicators designed by Colin Twiggs to highlight different aspects of buyer/seller sentiment or enthusiasm.
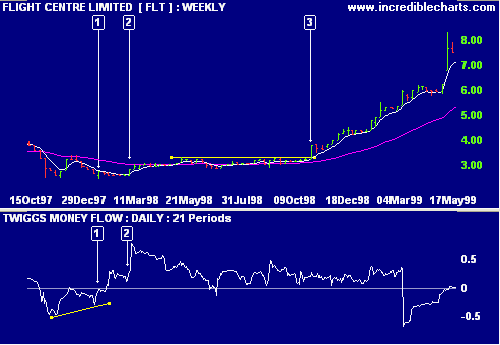
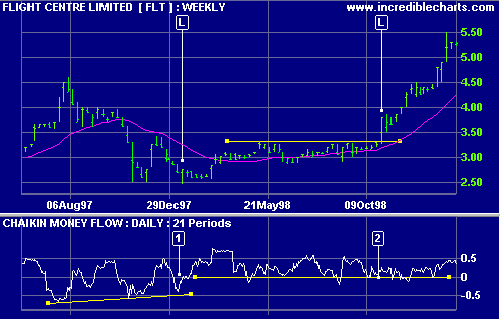
Twiggs® Money Flow
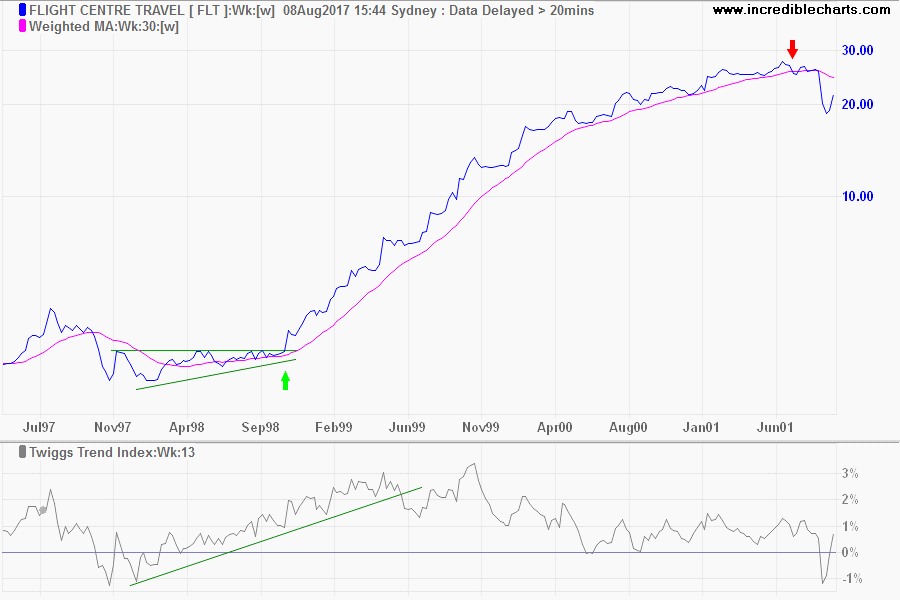
Twiggs® Trend Index
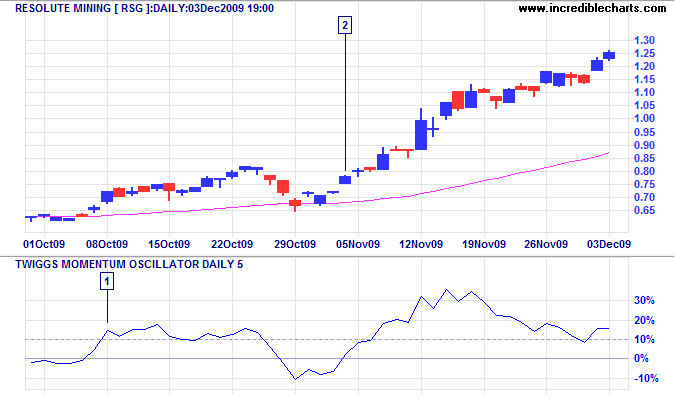
Twiggs® Momentum Oscillator
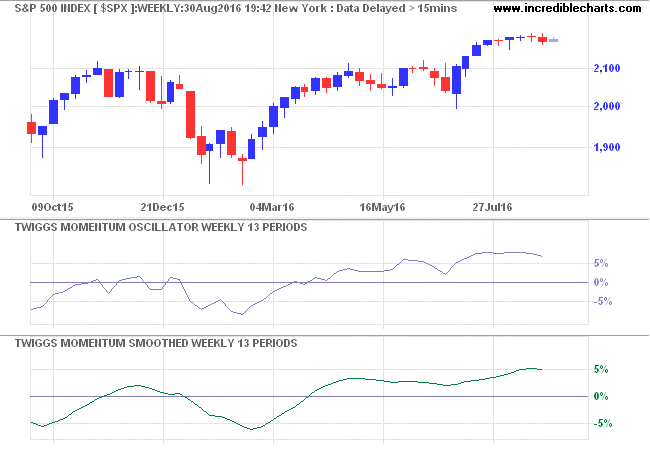
Twiggs® Smoothed Momentum
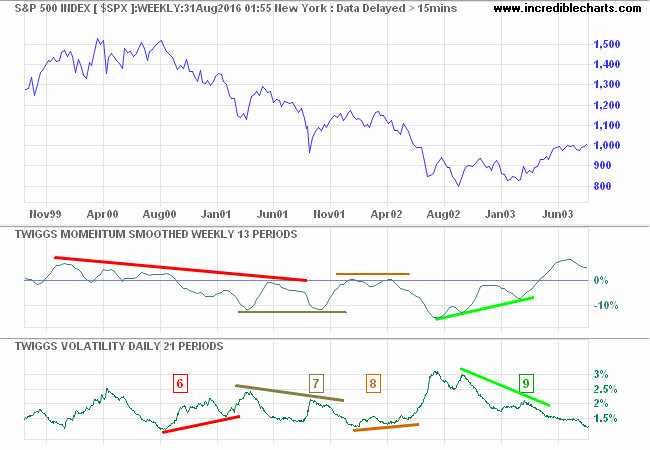
Twiggs® Volatility
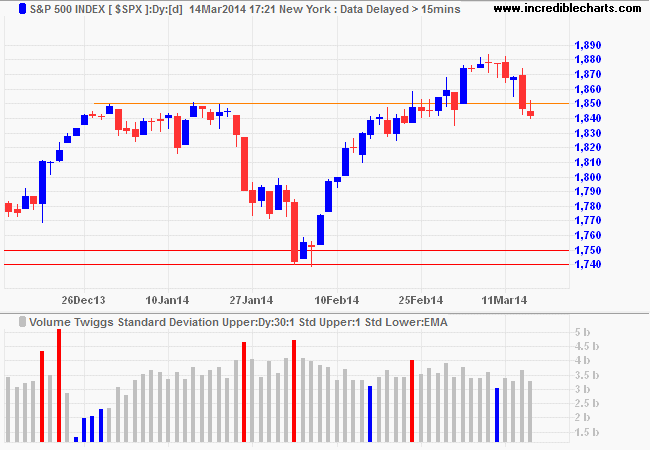
Volume Twiggs® Standard Deviation

Twiggs® ATR Bands

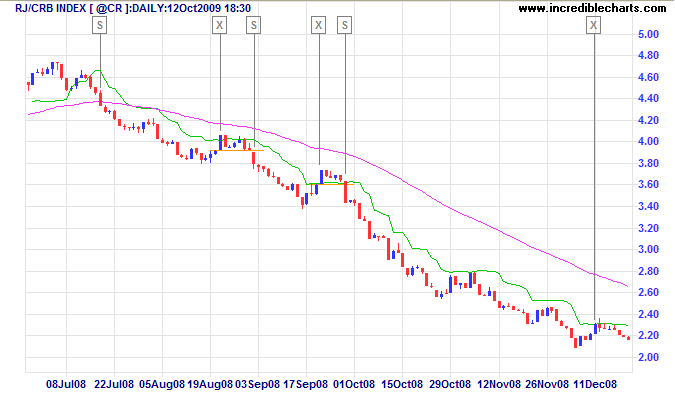
Twiggs® ATR Stops
Trading Ideas & Strategies
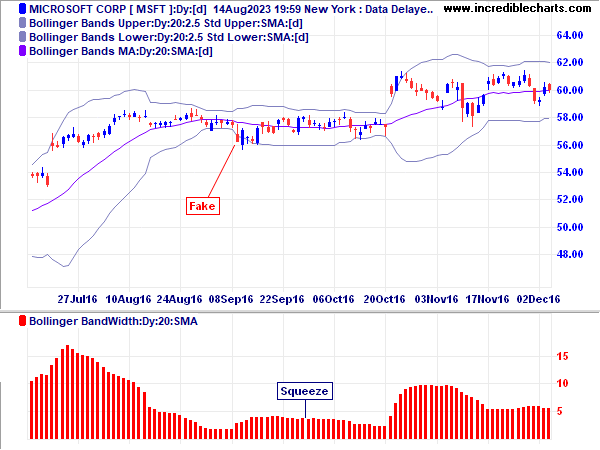
Bollinger Squeeze
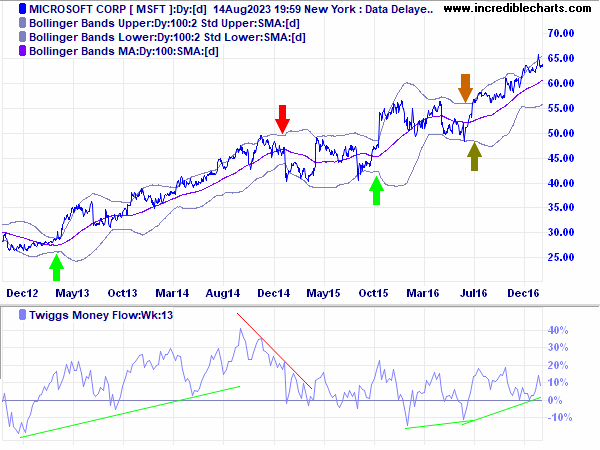
Bollinger Trends
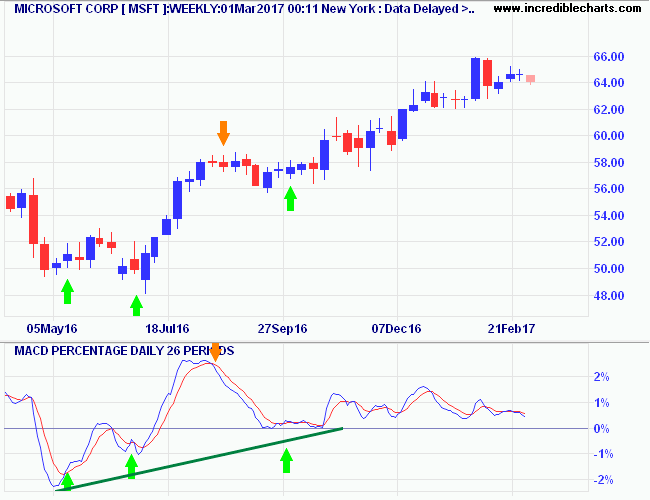
MACD: Two Great Trading Signals
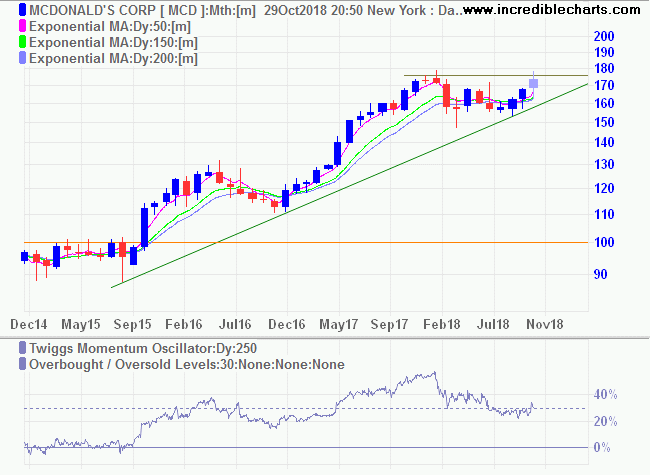
Minervini Trend Template
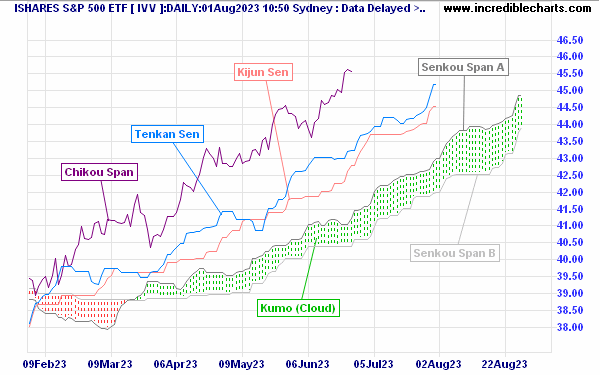
Trend Trading with Ichimoku Clouds

Scan for Breakouts

Scan for Momentum
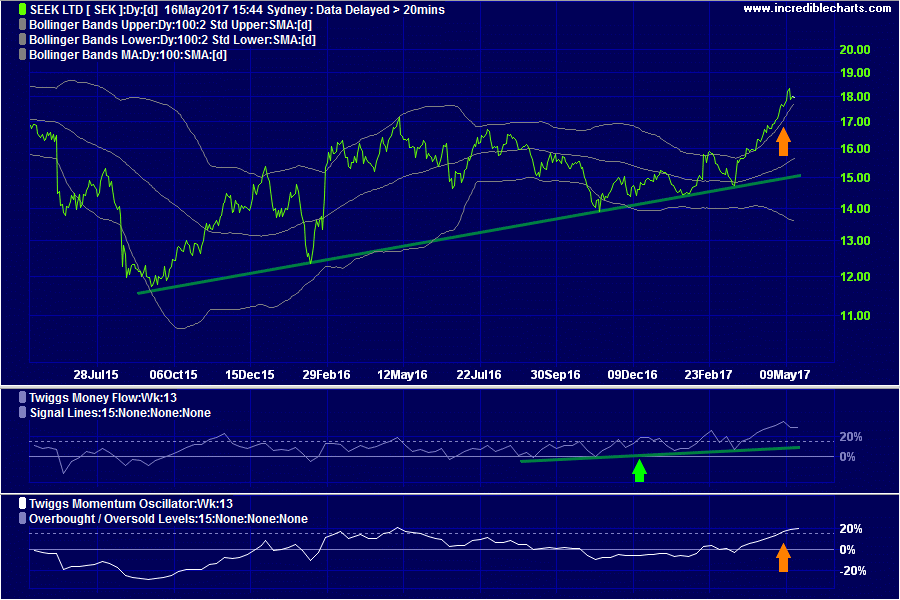
Twiggs Momentum & Money Flow
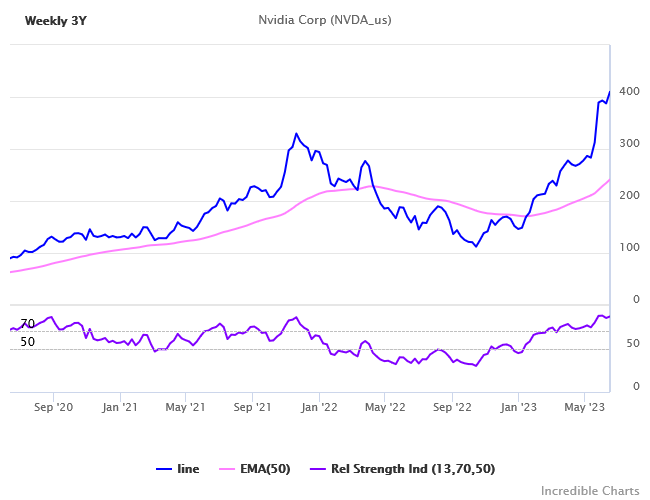
Surge in Momentum
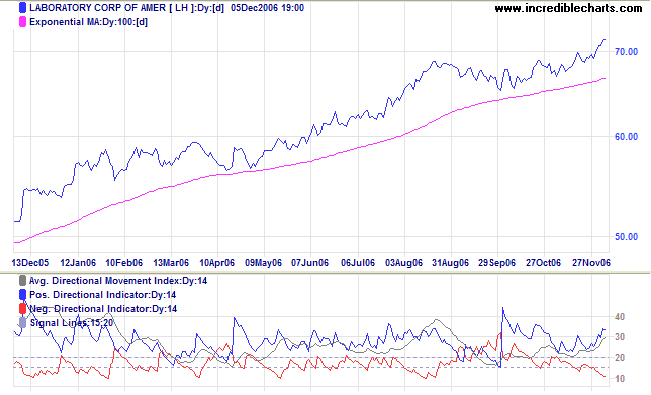
Scan for Trends
Trading Diary
Colin Twiggs and his team provide free monthly updates to more than 120,000 followers. Join our Trading Diary for:
- Free education
- Macro outlook; and
- Technical updates.
About: Colin Twiggs
Colin Twiggs is a former investment banker with almost 40 years of experience in financial markets. He co-founded Incredible Charts and writes the popular Trading Diary and Patient Investor newsletters.

Using a top-down approach, Colin identifies key macro trends in the global economy before evaluating selected opportunities using a combination of fundamental and technical analysis. Focusing on interest rates and financial market liquidity as primary drivers of the economic cycle, he warned of the 2008/2009 and 2020 bear markets well ahead of actual events.
Leading Market Indicators
Receive free weekly updates to Colin Twiggs' composite leading indicators for the US and Australian stock markets.
Bull-Bear Indicator
The Bull-Bear indicator reflects position in the stock market cycle, with low readings signaling a bear market.
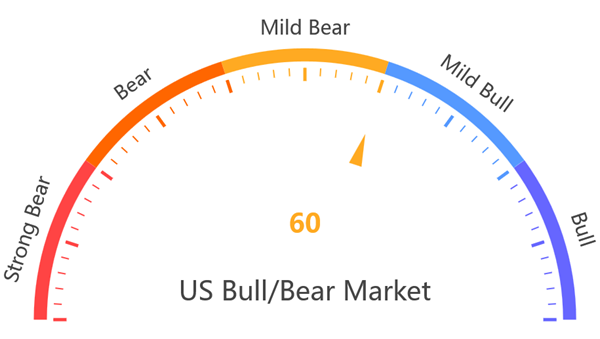
The US index is an equal-weighted composite of five groups of leading economic and technical indicators, including:
- The yield curve and Fed monetary policy
- Consumer surveys
- Heavy truck sales
- Employment in cyclical sectors

The Australian index includes a 40% weighting of the US index plus an equal-weighted composite of six leading economic and technical indicators for Australia:
- Australian forward orders and private housing approvals
- The ASX 200 index relative to gold
- The Financial sector index
- The NBS manufacturing PMI and OECD composite leading indicator for China
Stock Pricing Indicator
The Stock Pricing indicator reflects stock market drawdown risk. The higher the value, the greater the risk of a significant drawdown.
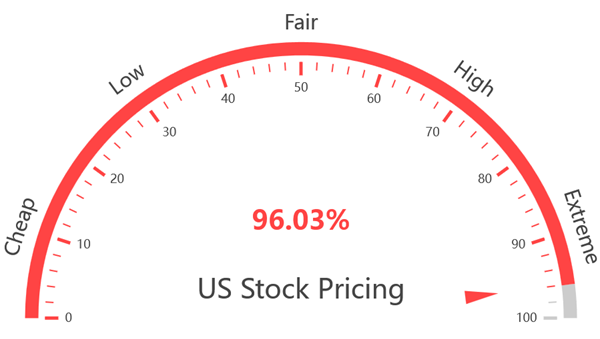
The US indicator calculates an equal-weighted z-score of five important metrics of stock market value:
- Warren Buffett's ratio of stock market capitalization to nominal GDP
- Robert Shiller's Cyclically Adjusted Price-Earnings Ratio (CAPE)
- S&P 500 Price-to-Sales ratio, Forward PE, and PE of highest trailing earnings
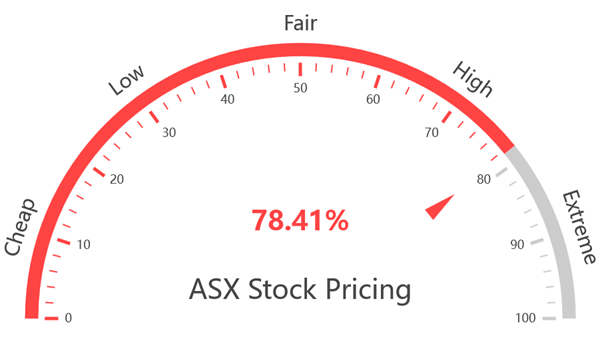
The Australian indicator includes similar Price-to-Sales ratio and Forward PE for the ASX 20 and plus trailing PE and dividend yield for the All Ordinaries Index.
See The Patient Investor - Managing Risk to learn more.
Sign up to The Patient Investor for free weekly updates.
Classic Windows Download
Incredible Charts popular desktop charting package:
- More than 420K Downloads
- Compatible with Windows 8, 10 & 11
- Download and install on your PC to receive a 30-day Free Trial

Indicators
Technical indicators highlight a particular aspect of price or volume behavior on a stock chart to provide valuable insights and help with analysis.
Newcomers often attach great significance to their favorite indicators, but none are infallible.
The key is to keep it simple and select indicators that complement each other and are suited to current market conditions.

Popular Indicators
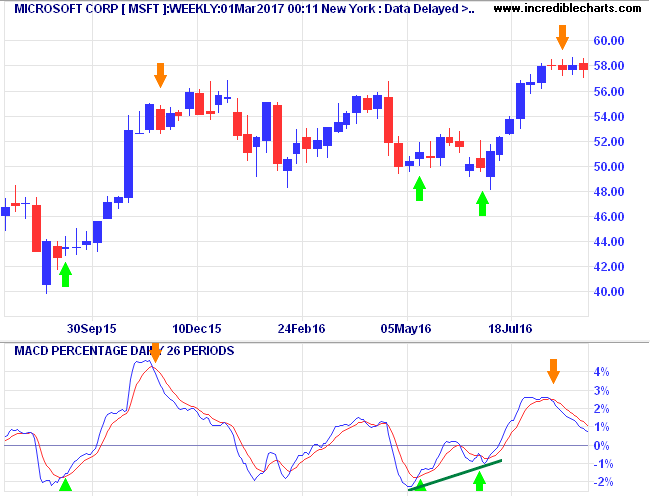
MACD
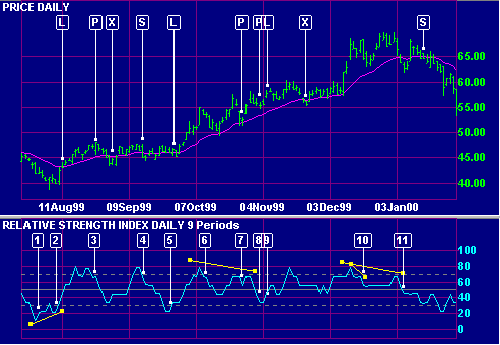
Relative Strength Index (RSI)
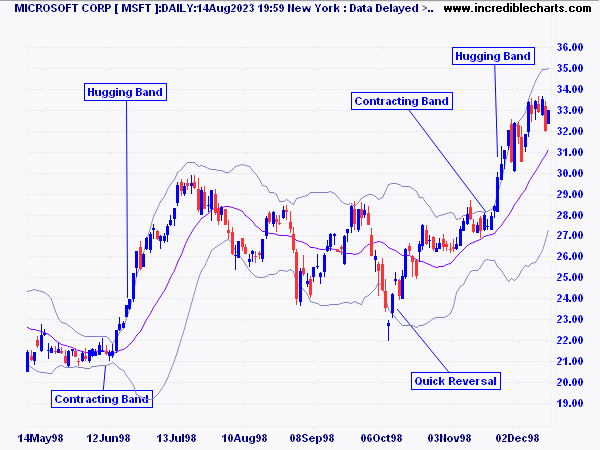
Bollinger Bands
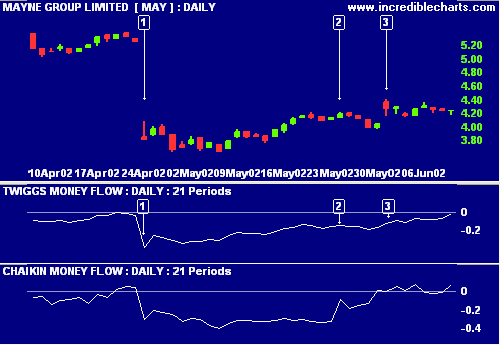
Twiggs Money Flow
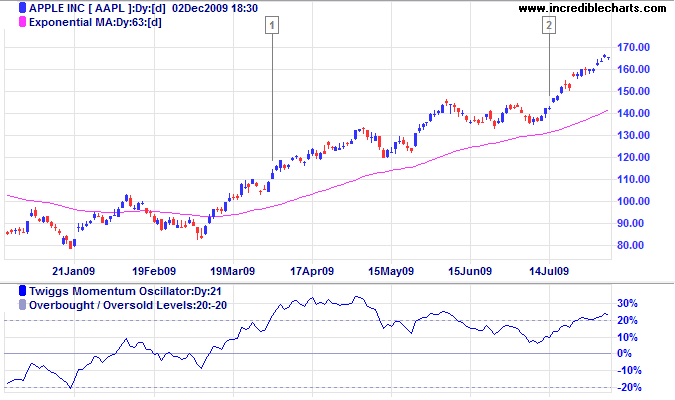
Twiggs Momentum
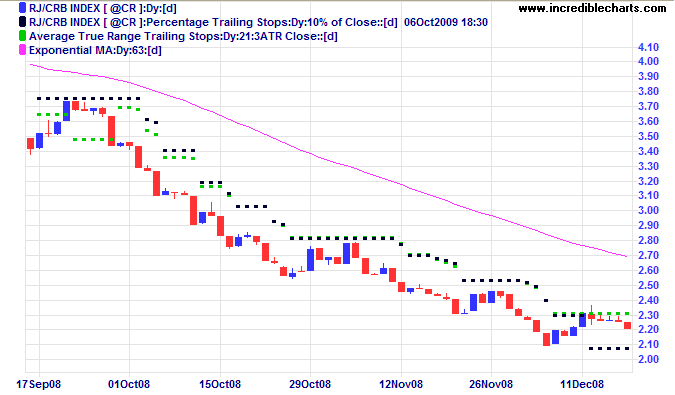
ATR Trailing Stops
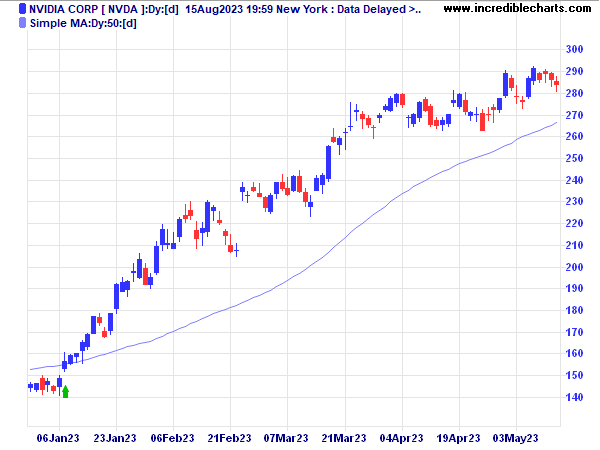
Moving Averages


