Screen for Trends - How to Identify a Surge in Momentum
A surge in momentum frequently occurs after a breakout: something has changed, news that has caused investors to abandon caution and chase the stock price higher. There are three stock screen filters that we can use to identify this:
- Directional Movement: DI Difference
- RSI Crossovers
- Twiggs Momentum
Momentum Screen Filters
Our focus is on long-term up-trends, that are expected to run for at least six months. We therefore use momentum filters with a time period of 13 weeks (half of the six month period).
DI Difference
Calculates the difference between current DI+ and DI- values.
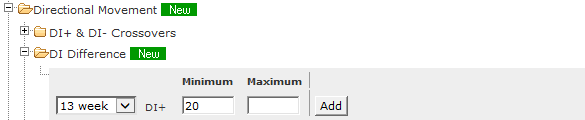
Try the following values:
- A Minimum of 20 or 25 for the S&P 500 or ASX 200
- A higher Minimum of 30 or 40 for faster-moving small caps in the Russell 3000 or ASX.
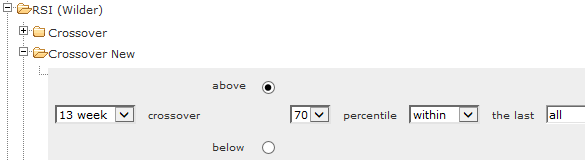
RSI Crossovers
Look for RSI Crossovers above 70 in recent weeks.
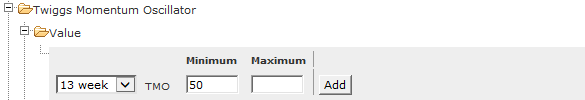
Twiggs Momentum
Look for Twiggs Momentum with a Minimum value of 50.
Example Screen Results
The results of our screen run on the S&P 500, Russell 3000, and ASX stocks are shown below.
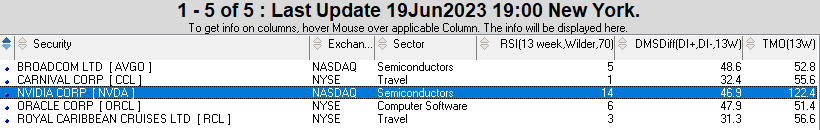
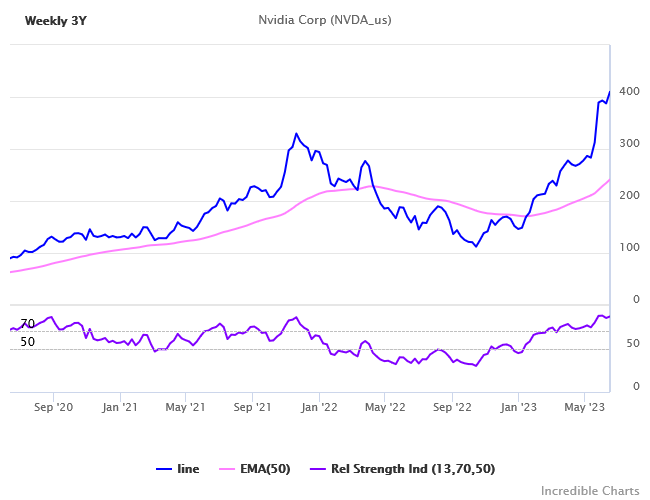
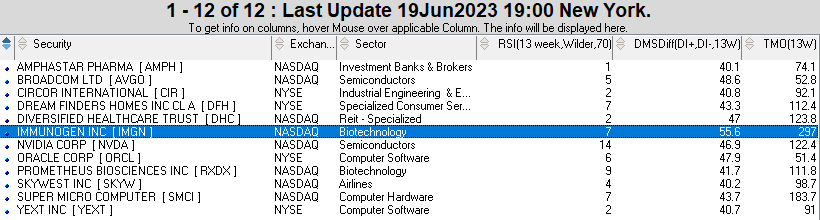
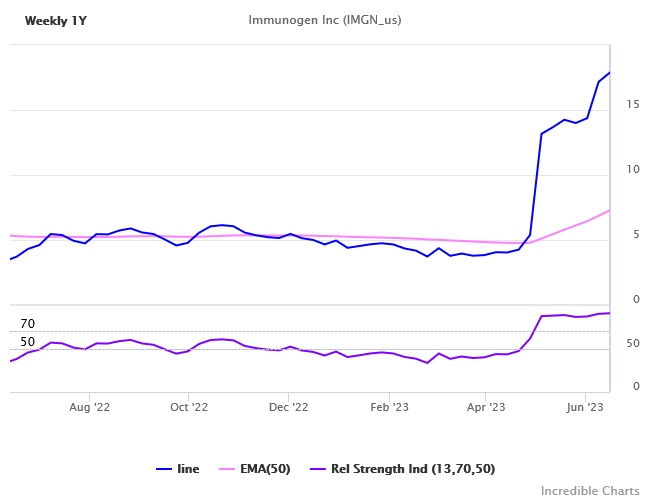
S&P 500
If we combine all three filters, we get the following results for the S&P 500.
RSI (13week,Wilder,70) values reflect the number of consecutive weeks above 70.
Russell 3000
We ran a higher Minimum of 40 (on DI Difference) for the Russell 3000 to reduce the number of stocks returned:
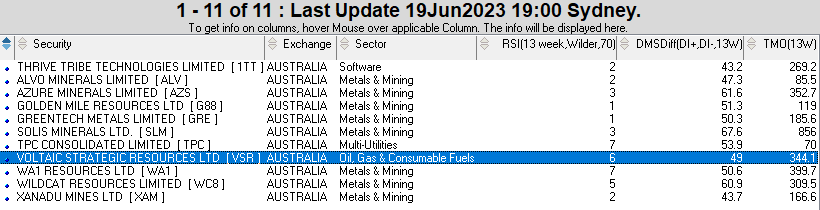
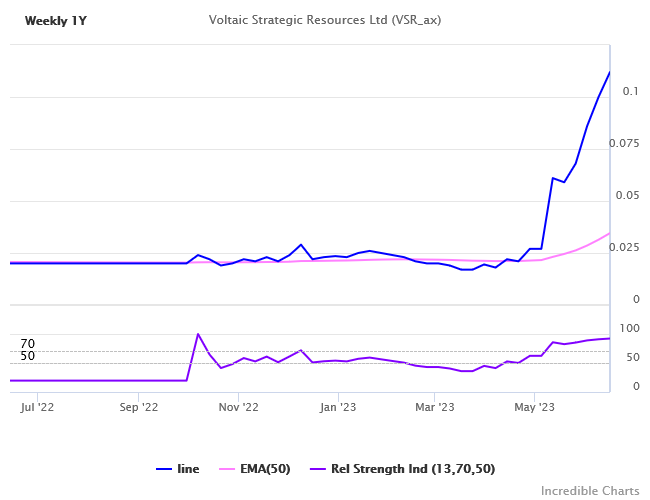
ASX
We had to go outside the All Ordinaries to find fast-trending stocks on the ASX:
Conclusion
We use three filters to find a surge in momentum:
- Directional Movement: DI Difference
- RSI Crossovers
- Twiggs Momentum
Adjust the minimum value for DI Difference depending on whether large or small cap stocks:
- At least 20 for the S&P 500 or ASX 200
- At least 30 for the broader Russell 3000 or ASX
Disclaimer
Please note that stocks shown are for illustration purposes only and are not recommendations. Readers should conduct their own research.
Read our full disclaimer.

Author: Colin Twiggs is a former investment banker with almost 40 years of experience in financial markets. He co-founded Incredible Charts and writes the popular Trading Diary and Patient Investor newsletters.
Using a top-down approach, Colin identifies key macro trends in the global economy before evaluating selected opportunities using a combination of fundamental and technical analysis.
Focusing on interest rates and financial market liquidity as primary drivers of the economic cycle, he warned of the 2008/2009 and 2020 bear markets well ahead of actual events.
He founded PVT Capital (AFSL No. 546090) in May 2023, which offers investment strategy and advice to wholesale clients.