MACD Indicator: Two Great Trading Signals
The MACD indicator is basically a refinement of the two moving averages system and measures the distance between the two moving average lines.
MACD is an acronym for Moving Average Convergence Divergence and was introduced by Gerald Appel in his book, The Moving Average Convergence Divergence Trading Method.
Basic MACD Signals
The MACD indicator is primarily used to trade trends and should not be used in a ranging market. Regular signals are taken when the indicator crosses its signal line, normally calculated as a 9-day exponential moving average (EMA) of MACD.
Trending Market
First check whether price is trending. If the MACD indicator is flat or stays close to the zero line, the market is ranging and signals are unreliable.
- Go long when MACD crosses its signal line from below.
- Go short when the indicator crosses its signal line from above.
Two Great MACD Signals
The problem with regular signals is that MACD is prone to whipsaws in the same way as the underlying moving averages on which it is based.
Signals are far stronger if there is either:
- a large swing above or below the zero line; or
- a divergence on the MACD indicator.
Use MACD Percentage Price Oscillator in order to consistently identify large swings. MACD Percentage is a variation of the MACD indicator that uses a percentage scale, enabling comparison between stocks at different prices.
Large Swings & Divergences
Microsoft Corporation weekly chart is plotted below with 26-day MACD Percentage and 9-day signal line.
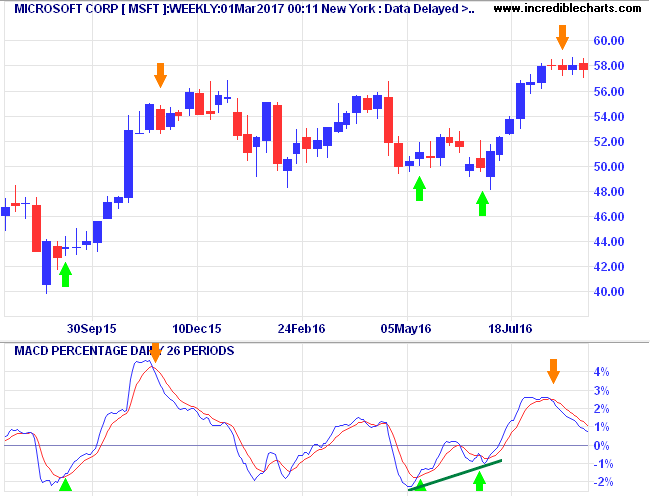
Swings above 2% or below -2% are traded as large swings. Divergences, where a second, smaller swing reverses below the 2% band, are also traded as strong signals. Green arrows signal Long trades and Orange arrows indicate Exits.
Only long trades are taken as MSFT has clearly been in an up-trend since early 2013.
- Go Long when MACD crosses above the signal line after a large (< -2%) swing.
- Exit when MACD reverses below the signal line after an opposite large swing > 2%.
- The next swing below zero is ignored as it does not reach -2%.
- Go Long on the next large swing < -2% in early May 2016.
- Ignore the next crossover close to the zero line.
- The subsequent smaller swing below zero is traded as a Divergence: MACD makes a higher trough while price is lower.
- Exit on the next large swing above 2%.
The later Microsoft chart below displays a strong up-trend that developed in late 2016. The exit from August 2016 (#7 above) is the orange arrow in the middle of the chart.
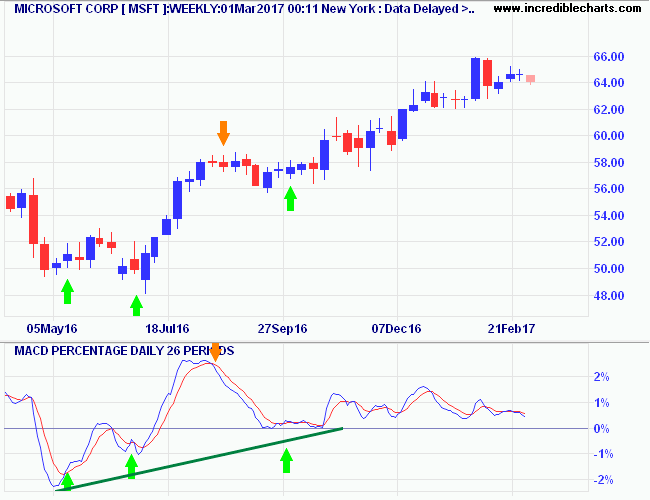
- There is only one new entry on this chart but an important one. The trough above zero, at the end of September 2016, flags a strong up-trend and we go Long in anticipation.
- Subsequent crossovers above the zero line are ignored as they are below the 2% threshold. It would be a mistake to treat one as a bearish divergence. MACD oscillating above the zero line reflects a strong up-trend. Oscillation below zero would likewise reflect a strong down-trend.
MACD: Trading Strong Trends
MACD Divergences are suitable for trading trending stocks that undergo regular corrections. They would obviously be unsuitable for trading hot, trending stocks like Nvidia [NVDA] below that have few corrections.
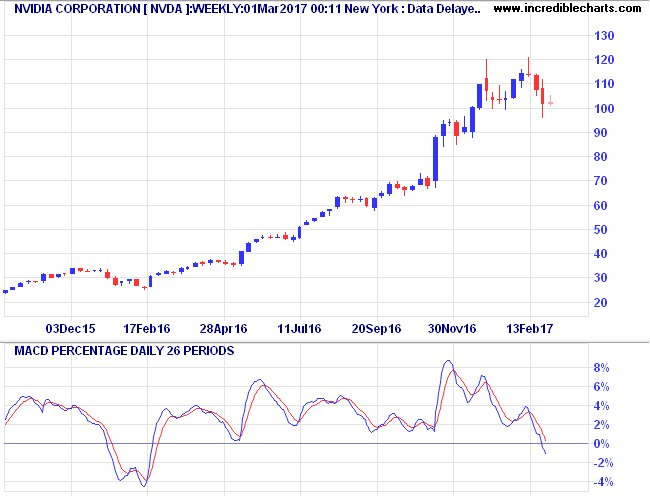
I would not trade high momentum stocks like Nvidia with MACD crossovers, even Divergences and/or large swings. Instead I would revert to a simple two-moving average system, only trading crosses above/below the zero line.
- Go Long when MACD (or MACD Percentage) crosses to above zero.
- Exit, or go short in a long-term down-trend, when the indicator crosses to below zero.
Use long-term momentum, like 50-week Twiggs Momentum in the example below, to identify strong trending stocks like NVDA.
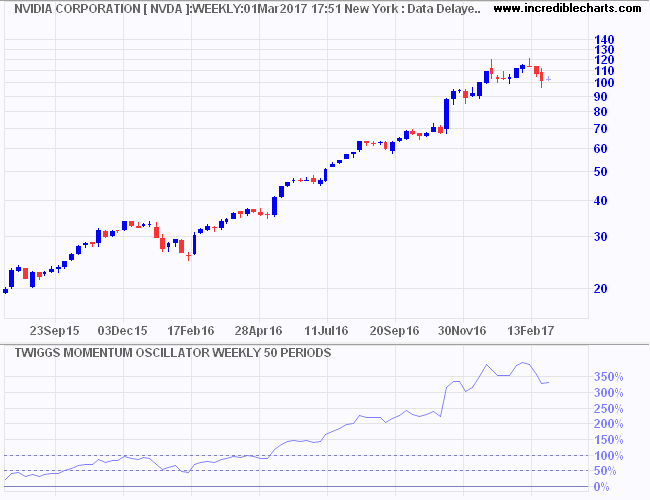
There is a gray area with values between 50% and 100% (Microsoft peaks around 40%) but anything over 100% is a clear warning to adapt your trading system.
Setup
The default settings for the MACD or MACD Percentage indicator are:
- Slow moving average: 26 days
- Fast moving average: 12 days
- Signal line: 9-day moving average of the difference between fast and slow.
- All moving averages are exponential.
See Indicator Panel for directions on how to set up an indicator. See Edit Indicator Settings to change the settings.
MACD Formula
The MACD indicator is calculated as the difference between the fast and slow moving averages:
MACD = 12-Day exponential moving average minus 26-Day exponential moving average
The signal line is calculated as a 9-day exponential moving average of MACD.
Example
Johnson & Johnson with a 12-day , and a 26-day exponential moving average (EMA) plotted on the price chart. MACD reflects the difference between the fast and slow EMA. The signal line is a 9-day EMA of the MACD indicator.
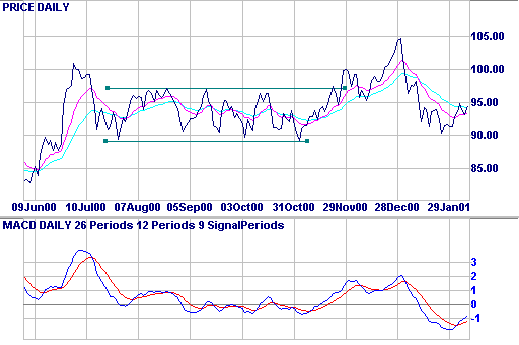
Observe that:
- MACD is furthest from the zero line when the gap between the two EMAs is widest.
- MACD is at zero when the two EMAs cross (the trading signal when using two moving averages).
- MACD fluctuates between 1.0 and -1.0 when the market is ranging.
Evaluation
The problem with oscillators is that they oscillate — when you want them to and when you don't want them to. By trading large swings and divergences you reduce the chance of whipsaws from minor fluctuations.
Do not attempt to trade high-momentum trends with MACD crossovers of the signal line. Rather opt for simple crossovers above/below zero.

Author: Colin Twiggs is a former investment banker with almost 40 years of experience in financial markets. He co-founded Incredible Charts and writes the popular Trading Diary and Patient Investor newsletters.
Using a top-down approach, Colin identifies key macro trends in the global economy before evaluating selected opportunities using a combination of fundamental and technical analysis.
Focusing on interest rates and financial market liquidity as primary drivers of the economic cycle, he warned of the 2008/2009 and 2020 bear markets well ahead of actual events.
He founded PVT Capital (AFSL No. 546090) in May 2023, which offers investment strategy and advice to wholesale clients.
