Ichimoku Cloud: Trading Trends
Ichimoku Cloud (or Ichimoku Kinko Hyo) is a technical analysis method that combines leading and lagging indicators with traditional candlestick charts in order to provide a comprehensive trend trading system.
Developed by Japanese journalist Goichi Hosoda in the 1960s, Ichimoku Kinko Hyo is translated as "one balance equilibrium chart", while the common name of Ichimoku Cloud refers to its appearance.
Ichimoku can be displayed as a separate indicator in Minute, Hourly, Daily, Weekly or Monthly format.
What are the 5 lines in Ichimoku?
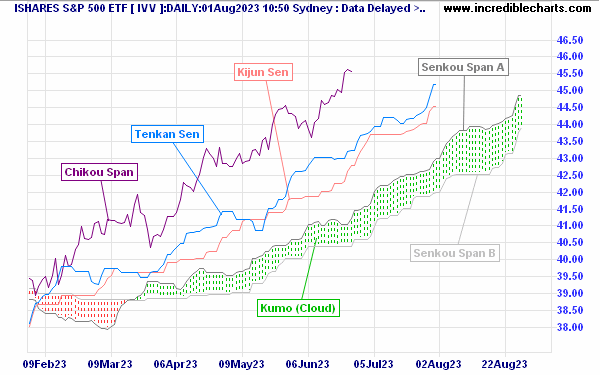
Ichimoku Cloud consists of 5 lines plotted on the Candlestick chart:
- Tenkan-Sen (blue) is often referred as the Conversion Line and is simply the mid-point of the latest 9 trading days/periods — the average of a 9-day High and 9-day Low on a daily chart.
- Kijun-Sen (red), or Base Line, is the mid-point of the latest 26 trading days/periods. The two lines (Tenkan-Sen and Kijun-Sen) are used in a similar fashion to fast and slow moving averages.
The Cloud (Kumo) itself consists of two leading moving averages:
- Senkou Span A is the mid-point between the first two lines, Tenkan-Sen and Kijun-Sen, but plotted 26 days/periods ahead of the current period.
- Senkou Span B is the mid-point between a 52-period High and a 52-period Low and is also plotted 26 days/periods in the future (ahead of the current day).
Last is the lagging indicator:
- Chikou Span is simply the Closing Price, but plotted 26 days/periods in the past.
Ichimoku Cloud Trading Signals
The Cloud (Kumo)
The position of the Cloud identifies the trend:
- The trend is upward when price is above the Cloud.
- The trend is downward when price is below the Cloud.
- The trend is flat (undetermined) when price is in the Cloud.
The Cloud is green when Senkou Span A is above Span B and red when Span A is below. Cloud color further enhances the trend signal:
- A predominantly green cloud indicates a strong uptrend (or weak downtrend if price is below the cloud).
- A predominantly red cloud indicates a strong downtrend (or weak uptrend if price is above the cloud).
Trading in an Uptrend
Price should be above the Cloud. Signals are strongest when the latest Cloud color (ahead) is green rather than red.
There are two signal strengths:
- Go long when Price crosses above the Kijun-Sen (red) line; or
- Go long when Tenkan-Sen (blue) crosses above Kijun-Sen (red), confirming the earlier signal.
- Exit when Price crosses below Kijun-Sen (red); or
- Exit when Tenkan-Sen (blue) crosses below Kijun-Sen (red), confirming the earlier signal.
Example 1 - Buy Signals in an Uptrend
The S&P 500 index is plotted on a weekly chart with Ichimoku Cloud.
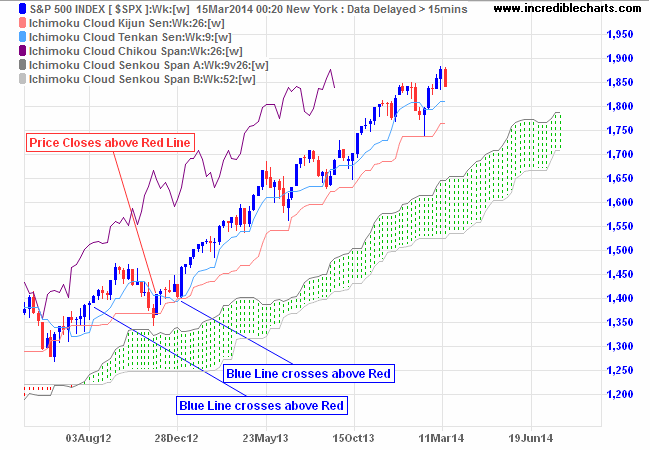
Price above the Cloud indicates an uptrend. The first buy signal is when the blue line (Tenkan-Sen) crosses above the red (Kijun-Sen), after the green Cloud indicates the trend is firmly established. The second long entry (if pyramiding) is when Price closes above the red (Kijun-Sen) line. Again, the green cloud indicates an established trend. A third entry signal is available when the blue line (Tenkan-Sen) again crosses above the red (Kijun-Sen). Exit if Price closes below the red line (Kijun-Sen) — or the blue line (Tenkan-Sen) crosses below the red.
Trading in a Downtrend
Price should be below the Cloud. Signals are strongest when the latest Cloud color (ahead) is red rather than green.
There are two signal strengths:
- Go short when Price crosses below the Kijun-Sen (red) line; or
- Go short when Tenkan-Sen (blue) crosses below Kijun-Sen (red), confirming the earlier signal.
- Exit when Price crosses above Kijun-Sen (red); or
- Exit when Tenkan-Sen (blue) crosses above Kijun-Sen (red), confirming the earlier signal.
Example 2 - Sell Signals in a Downtrend
The S&P 500 index is plotted on a daily chart with Ichimoku Cloud.
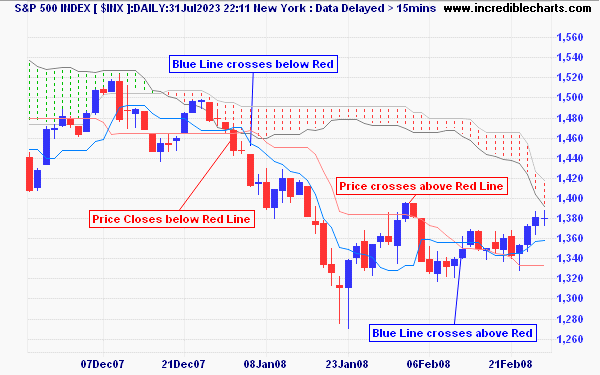
Price below the Cloud indicates a downtrend. The red cloud confirms an established trend. Go short when price or the blue line (Tenkan-Sen) cross below the Red Line (Kijun-Sen). Exit when price crosses above the red line or the blue line crosses above the red line.
Trading Signals in a Strong Trend
How to identify a strong trend: the blue line does not cross below the red.
In a strong trend, short-term traders may find that crosses of the red (Kijun-Sen) line are few and far between. Consider long entries where Price closes above the blue (Tenkan-Sen) line and short entries (in a downtrend only) when Price closes below the line.
Example 3 - Buy Signals in a Strong Trend
Netflix [NFLX] is plotted on a weekly chart with Ichimoku Cloud.
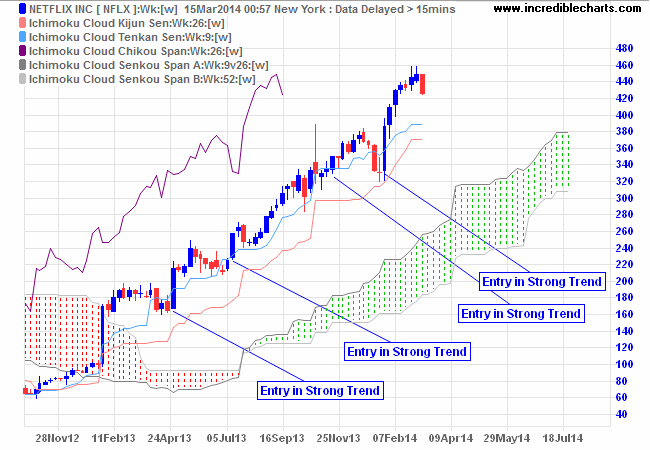
Price above the Cloud indicates an uptrend. The blue line (Tenkan-Sen) holding above the red (Kijun-Sen) indicates a strong trend. Enter when Price dips below and then closes back above the blue line. Exit if Price closes below the red line (Kijun-Sen) or the blue line (Tenkan-Sen) crosses below the red.
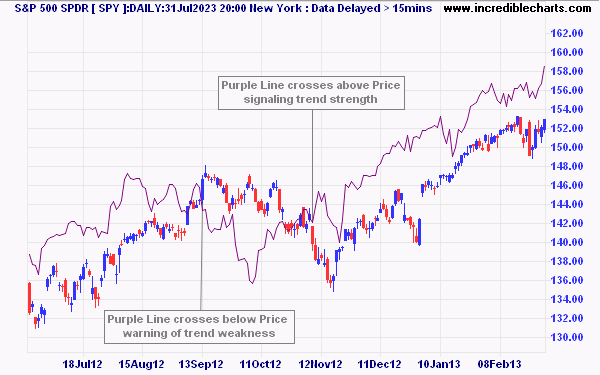
Long-term Trend Signals
If Chikou Span (purple line) crosses above price it signals a long-term up-trend, while Chikou Span below price warns of a down-trend.
Setup
Select Indicators on the Top menu then Ichimoku Cloud in the left column of the Indicator Panel. See Indicator Panel for directions on how to set up an indicator.

Author: Colin Twiggs is a former investment banker with almost 40 years of experience in financial markets. He co-founded Incredible Charts and writes the popular Trading Diary and Patient Investor newsletters.
Using a top-down approach, Colin identifies key macro trends in the global economy before evaluating selected opportunities using a combination of fundamental and technical analysis.
Focusing on interest rates and financial market liquidity as primary drivers of the economic cycle, he warned of the 2008/2009 and 2020 bear markets well ahead of actual events.
He founded PVT Capital (AFSL No. 546090) in May 2023, which offers investment strategy and advice to wholesale clients.