How to Trade Trends
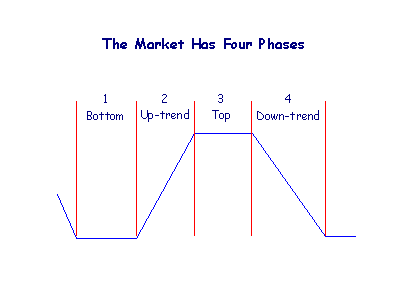
The market has 4 basic phases and no trading system is suited to all of them. Some systems are suited to Phases 1 and 3, when the market is ranging, while others are designed to trade the trends in Phases 2 and 4.
Trend-trading systems are more popular as they are less intensive and may generate larger returns. There a 6 basic steps that you need to follow for a successful trend-trading system.
Trading Trends
The object of trend-trading is to go long at the transition from Phase 1 to Phase 2 and to exit before Phase 4. Some models also short the market during Phase 4, but this should be left to experienced traders .
Successful systems are built around the following principles:
- Selecting securities.
Use the Stock Screener to identify potential Market Leaders.
- Market direction.
(a) Decide on the Time Frame that you are trading.
(b) Confirm the Market Direction using a suitable trend indicator. - Trend direction.
Using the same indicator, check the Trend Direction of each security.
- Entry signals.
(a) Take Entry Signals from a suitable momentum oscillator.
(b) Use Trailing Stops to time entry and exit points. - Stop losses.
(a) Set Stop Loss Orders as soon as your trade is confirmed.
(b) Do not exceed the Maximum Acceptable Loss.
(c) Be technically consistent when Setting Stop Levels.
(d) Adjust Stop Levels over time to protect your profits. - Exit signals.
Take Exit Signals from a suitable trend indicator.
1. Market Leaders
When selecting stocks, focus on market leaders rather than laggards.
Only
invest in businesses that you understand. If
you are not confident in your ability to separate the good from the bad then
use a stockbroker's or financial advisor's recommendations.
Alternatively, consider investing in a good growth fund and switch in/out with
the primary trend.
Market Leaders
Use the Stock Screener to compare the relative performance of all stocks over the past 12 months. Analyze the top 10 per cent:
- Have sales and earnings per share grown strongly over the past 3 years?
- Have sales and earnings per share growth accelerated in recent quarters? Be
on the alert for cost reductions and layoffs that may enhance
short-term performance at the expense of long-term growth.
-
Look for sustainable competitive advantage and strong growth prospects.
Does the company have a competitive edge? Examine their products or services: do they have better technology; stronger brands; copyrights or patents; or greater expertise; that gives them an advantage over competitors?
Industry Sectors
Use the Stock Screener to identify the industry sectors that show the best relative performance. Select stocks from top industry sectors:
- Look for two or more market leaders in the same industry sector.
- Compare the relative performance of industry sectors over the last 3 years and look for market leaders from these sectors.
Resistance Levels
Select stocks that are clear of major resistance
levels. Look for market leaders that have recently made new highs or turnarounds that
are well below major resistance levels.
Example
Charles Schwab is charted below with weekly Price Ratio showing performance relative to the S&P 500.
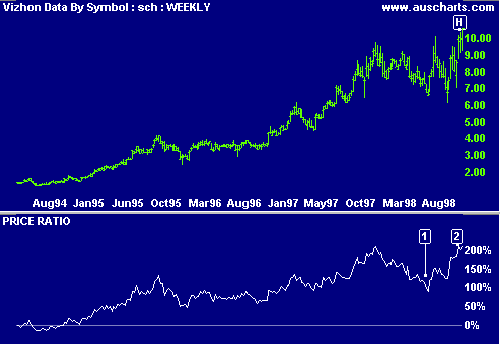
Securities Brokers were one of the leading industry sectors in the 90's. Charles Schwab reached a new high on 20 October 1998 on the back of strong earnings growth.
- The Price Ratio, depicting stock performance relative to the S&P 500, fell sharply during the mid-1998 correction [1].
- Price Ratio recovers sharply in the third quarter [2], making a new high [H] on 20 October.
2. Market Direction
The overall market influences the performance of smaller markets and individual stocks. Study the big picture first before looking at any shares in isolation.
(a) Time Frame
Decide on the cycle that you are going to trade:
- Long-term (or primary) trends that are measured in years;
- Intermediate (or secondary) trends of 3 weeks up to 6 months;
- Short-term cycles of less than 3 weeks; and
- Intra-day trends.
This will influence your indicator settings. More details can be found at Time Frames and Indicator Time Frames.
(b) Trend Indicator
Trade only in the direction of the overall market:
- Use a trend indicator to determine the direction in which the market is trending.
- Chart either the Dow Industrial Average, Standard &
Poor 500 or the NASDAQ index.
The Dow comprises the top 30 blue chip industrial stocks while the S&P 500 is more representative of the entire market. The NASDAQ has more influence on tech stock prices. - In addition, chart a local market index such as the FTSE 100 for the UK market or the ASX 200 for Australia, if you are trading outside the USA.
Reading The Market discusses a number of systems used to determine market direction.
Example
The Standard & Poor 500 is charted with 7-day and 150-day exponential moving averages, used to track the primary trend.
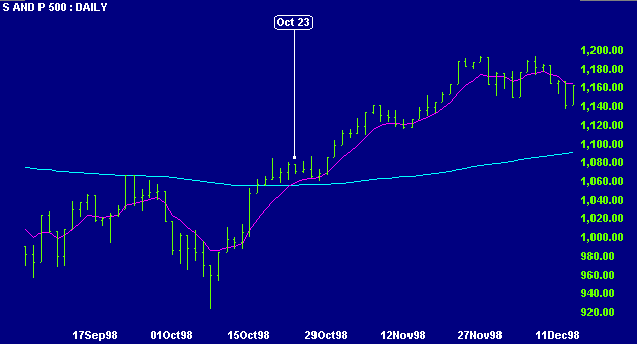
An up-trend is signaled on October 23rd when:
3. Trend Direction
Trade only in the direction of the trend:
Use a trend indicator to identify whether the security is trending or ranging. Only take signals if the security is trending upwards.
Example
Charles Schwab is charted with 7-day and 150-day exponential moving averages, used to track the primary trend.
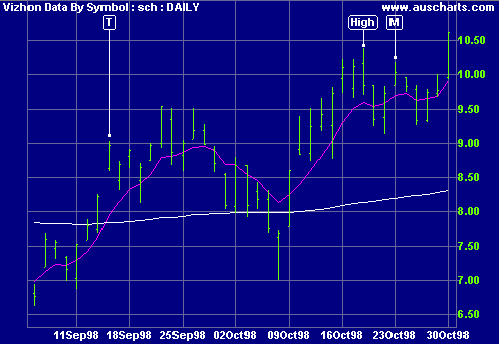
By October 23rd, when the market signals an up-trend [M], the stock is trending strongly upwards:
This is also evident from the successively higher peaks and troughs on the secondary cycle and the new High reached on October 20th.
4. Entry Signals
(a) Entry Signals
The merits of the different oscillators are discussed at Momentum Indicators. It is also possible to use an oscillator such as the Money Flow Index or MACD to time your entry points. In fact, some analysts do not use indicators at all and base their entry points on breakouts above resistance levels.
Set the Indicator Time Frame to suit the cycle being traded. There is a trade-off between indicator responsiveness and reliability: a very short time frame may provide earlier, but occasionally incorrect, signals. Trailing stops help to compensate for this.
(b) Trailing Stops
Trailing Stops are useful for weeding out premature or false signals and help to alleviate some of the psychological pressure on traders - by providing automatic entry and exit points.
Example
Charles Schwab with 7-day and 150-day exponential moving averages and 7-day relative strength index.
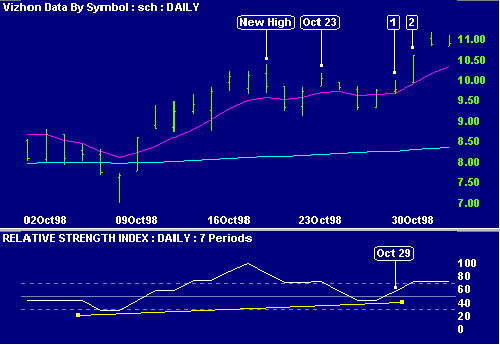
- Favorable trading conditions (from Steps 2 & 3) commence on October 23rd. Shortly thereafter the
RSI crosses to below zero and turns back above the zero line, giving a signal to go long [Oct 29].
The signal is strengthened by a failure swing, shown by the trendline.
Place a buy stop order above the High on the signal day [1]. - We are stopped in on day [2] when price rises above the High of the previous day. By the close the stock had formed a new High, surpassing the High of October 20th.
5. Stop Loss Protection
A Stop-Loss is an order which is only placed in the market if price falls to a specified level (if short, the stop is activated if price rises to a specified level). If used correctly, they help to limit the losses on individual trades.
Further details can be found at the links provided.
(a) Stop Losses
Stop-losses should be set as soon as each trade is confirmed. Set the stop-loss one tick below the lowest Low since the signal day.
(b) Maximum Acceptable Loss
Set your Maximum Acceptable Loss on any one trade, as a percentage of the capital committed. Never enter a trade if the stop-loss will exceed this limit.
A long-term investor/trader with reasonable risk diversification may set a limit of 6% while a short-term trader may set a limit of 2%.
(c) Setting Stop Levels
Be technically consistent when Setting Stop Levels. Use support and resistance, highs and lows or other technical levels for your limits.
(d) Adjusting Stop Levels
Using technical levels as in (c), Adjust Stops, over time, in the direction of the trend. This helps to protect your profits without fear of being stopped out before the trend is broken. A long-term investor/trader with reasonable risk diversification may find 6% an acceptable limit. A short-term trader may set a limit of only 2%.
Apart from adjusting stop levels upwards to below successive troughs, the alert trader should watch for chart patterns that may signal significant turning points. This doesn't mean that stops should be adjusted for every minor reversal signal but it is advisable to adjust stops for very strong signals, such as head and shoulders, when confirmed by unusually high volume. When in doubt, take profits by adjusting the stop for only part of your position.
Example 1
Charles Schwab with 150-day exponential moving average. The trendlines depict the stop levels as they are adjusted over time.
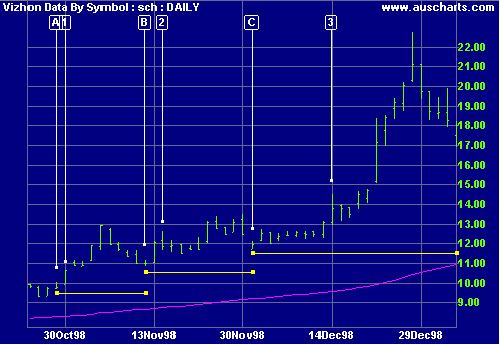
- The trade is entered on October 30th, day [1]. As soon as the trade is confirmed, set the stop-loss at just below the Low of the signal day [A].
- Price has formed a higher trough. Adjust the stop loss to just below the Low of [B].
- A higher trough is formed. Move the stop loss to below the Low of [C].
Adjust the stop upwards to below each successive low of the secondary cycle. Each new stop level is indicated by the start (left) of a new trendline. It is sometimes difficult to distinguish between the short cycle and the secondary cycle - weekly charts can be used to eliminate minor fluctuations.
Example 2
Charles Schwab with 150-day exponential moving average and 20-day volume moving average.
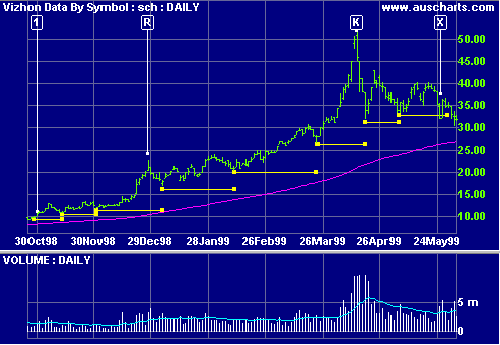
- Entry day.
- Unusually high volumes at the end of a strong up-trend lasting several
months, alert us to the exhaustion gap
in April '99. The following day is a key
reversal [K] with a very wide range.
The combination is sufficiently extreme to justify moving the stops up to the High of the day prior to the gap. The position is stopped out when the gap is closed on the day following the key reversal [K]. - Patterns are easy to detect with hindsight - it is difficult at the time to distinguish between extreme signals such as [K] and more regular signals such as [R].
- If the [K] signal was used to take profits (say sell off 50% of the position) then the trader would continue to adjust stops upwards. Price breaks below the stop level at [X] and the remaining position is stopped out.
6. Exit Signals
Trade Indicators
Use a Trend Indicator to exit from the trend. Adjust the Indicator Time Frame to suit the cycle being traded.
Example
Charles Schwab with weekly price bars and 7-day and 150-day exponential moving averages.
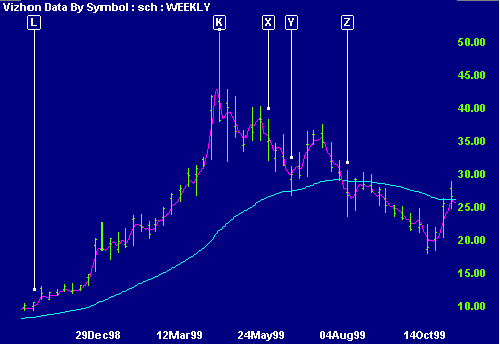
- Entry [L] on 30 October 1998 at $10.13.
- Exit on Key Reversal at [K] on 15 April 1999 at $44.75.
- Remaining position stopped out at [X] on 25 May 1999 at $33.13.
- Price crosses below MA150 at [Y] on 14 June 1999 at $27.25.
- MA7 crosses below MA150 at [Z] on 4 August 1999 at $24.50.
If no stops had been activated, the position would have been closed either:
- At [Y] when price fell below the 150-day moving average; or
- At [Z] when the 7-day MA fell below the 150-day MA,
depending on the exit strategy.
Trade Summary
| Entry [L] | October 30, 1998 | $10.13 |
| Key Reversal [K] | April 15, 1999 | $44.75 |
| Stopped Out [X] | May 25, 1999 | $33.13 |
| Price crosses below MA150 [Y] | June 14, 1999 | $27.25 |
| MA7 crosses below MA150 [Z] | August 4, 1999 | $24.50 |
Returns vary between 440 per cent and 240 per cent.
Note how important it is to exit at the right time in addition to timing the entry: the correction retreated to below $18.00.
A Word Of Caution
These are typical steps that a trader will follow in deciding what stocks to buy, when to buy them and when to sell. It is not a magic formula, but consistent use should enhance your investment performance.
Trading methods can be compared to a carpenter's tools: Skilled use can produce outstanding results but unskilled use may lead to injury. Learn to use your trading tools properly before committing any capital. Study the behavior of the indicators over several years, learn their strengths and weaknesses and how they interact with each other and with the market. Start with a small amount of capital and only increase this when you are confident that you have a winning strategy.
For more information on the difficulties of trend-trading see: Pitfalls of Trend Trading.

Author: Colin Twiggs is a former investment banker with almost 40 years of experience in financial markets. He co-founded Incredible Charts and writes the popular Trading Diary and Patient Investor newsletters.
Using a top-down approach, Colin identifies key macro trends in the global economy before evaluating selected opportunities using a combination of fundamental and technical analysis.
Focusing on interest rates and financial market liquidity as primary drivers of the economic cycle, he warned of the 2008/2009 and 2020 bear markets well ahead of actual events.
He founded PVT Capital (AFSL No. 546090) in May 2023, which offers investment strategy and advice to wholesale clients.