Price Ratio (Relative Strength)
The Price Ratio (or relative strength - comparative) serves a similar purpose to Price Comparison - it compares the performance of one stock relative to another (or to an index). Some traders use the Price Ratio as a general tool to select outperforming stocks.
Price Ratio is calculated by dividing the closing price of the first stock by the second.
Unlike Price Comparison, Price Ratio is plotted in a separate indicator panel. There are three options available:
- Price Ratio is adjusted so that the indicator line always starts at zero on the left of the chart.
- Price Ratio (Unadjusted) makes no such adjustment and simply displays the raw ratio of closing price between two securities.
- Relative Strength is similar to Price Ratio except that you are able to set the intercept date (at which the indicator line is equal to zero) to any date on the chart for which there is data history. If left blank, the date will default to the earliest available date for the two data histories.
The advantage of Relative Strength over Price Ratio is that the line does not reset every time you vary the chart time period. This is important if you are going to draw trendlines or captions.
Relative Strength Trading Signals
The Relative Strength indicator is not identical to the Relative Strength on Mansfield Charts — popularized by Stan Weinstein in his book Secrets For Profiting In Bull And Bear Markets. It is, however, very similar and can be used with Weinstein's long-term breakout system.
Example
Apple is compared to the NASDAQ 100 index using Relative Strength and Price Ratio indicators.
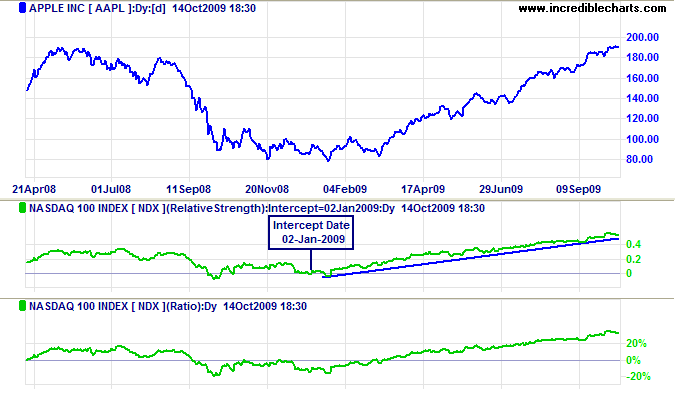
Mouse over chart captions to display trading signals.
The two lines are the same, except that Price Ratio is zero at the start of the chart, while Relative Strength is zero at the intercept date (2-Jan-2009). The difference is that you can plot trendlines on the Relative Strength indicator.
Price Ratio Setup
To set up the Price Ratio indicator:
- Open the Indicator Panel
- Select Price Ratio in the left column
- Select the comparative security or index from the drop-down menu
- Select Daily, Weekly or Monthly from the center panel
- Select Apply to Security or Apply to Project in the center panel.
Apply to Project applies the indicator to all securities in the current project.
Apply to Security applies the indicator to the current stock/index only. - Save the settings using ">".
Setup
Setup for the Relative Strength indicator is similar to the Price Ratio.
- Open the Indicator Panel
- Select Relative Strength (Compare) in the left column
- Select a second security or index from the drop-down menu
- Select Daily, Weekly or Monthly in the center panel
- Enter the Start Date or leave as Default (the intercept date will be taken as the earliest date shared by the two stocks).
- Select Apply to Security or Apply to Project in the center panel.
- Save the settings using the [>>] button.
Formula
The Price Ratio is calculated using the ratio of closing price to that of another security, on the first day of the chart. This means that the starting point of the Price Ratio will vary according to the Time Period selected. The line may appear to move if you change time periods, but the slope remains the same.
Tip
Settle on one or two standard time periods to be used when viewing Price Ratios (eg. 3 Years - Weekly; 6 Months - Daily).
The steps required to calculate the Price Ratio are best illustrated by an example: Calculate the Price Ratio of IBM to the Dow Jones Industrial Average (DJI)-
- Calculate the Inverse Ratio on Day 1: DJI divided by IBM.
- Divide IBM by DJI each day
- Then multiply step 2 by the Inverse Ratio in step 1
- The Price Ratio then reduces the start to zero by subtracting 1 (from step 3).
Example
| Day | IBM | DJI | Inverse Ratio (DJI / IBM) |
IBM / DJI | IR* IBM/DJI | Price Ratio |
|---|---|---|---|---|---|---|
| 1 | 8.00 | 4000 | 500 | 0.002000 | 1.000000 | 0.000000 |
| 2 | 7.95 | 4020 | 0.001978 | 0.988806 | -0.011194 | |
| 3 | 8.30 | 4010 | 0.002070 | 1.034913 | 0.034913 |
Note: Metastock ® use a different formula to normalize to zero. They calculate the ratio in step 2 and then subtract the ratio on day 1 from each subsequent day. The results are similar.
Relative Strength Formula
Relative Strength is calculated as follows:
- Determine the Intercept Ratio — the ratio between the closing price of the two data sets on the specified intercept date.
- Determine the closing price ratio on the current date (stock 1/stock 2).
- Multiply the result by the Intercept Ratio and subtract 1.
Relative Strength is plotted using the ratio of closing price to that of another stock or index, on the date specified or the default date, whichever is the later. The default date is taken as the earliest possible date (i.e. the commencement date of the shorter of the two data histories). For example, if we plot the price ratio of Microsoft against the S&P 500 the default date will be 01-Jun-1993, the start of the Microsoft data history, which is later than the 02-Jan-1980 start of the S&P 500 data series.

Author: Colin Twiggs is a former investment banker with almost 40 years of experience in financial markets. He co-founded Incredible Charts and writes the popular Trading Diary and Patient Investor newsletters.
Using a top-down approach, Colin identifies key macro trends in the global economy before evaluating selected opportunities using a combination of fundamental and technical analysis.
Focusing on interest rates and financial market liquidity as primary drivers of the economic cycle, he warned of the 2008/2009 and 2020 bear markets well ahead of actual events.
He founded PVT Capital (AFSL No. 546090) in May 2023, which offers investment strategy and advice to wholesale clients.