Breakout Model
Stan Weinstein, in Secrets for Profiting in Bull and Bear Markets, provides one of the most complete models for trading long-term trends. The model employs a combination of proven techniques to identify breakouts from a trading range, to follow the progress of a trend and to identify appropriate exit points. It is important to read the book to understand the full model which is briefly summarized below.
Trading Ranges
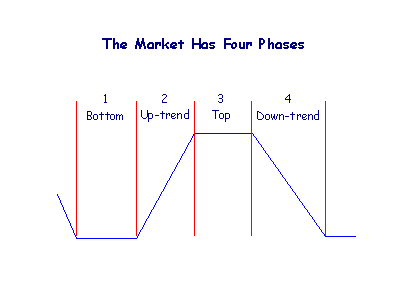
The long-term cycle has four distinct phases:
- phases 1 and 3 being trading ranges or reversal patterns; and
- phases 2 and 4 being trends.
The phases are not always as easy to identify as in the above illustration: a trend may last more than a year and a reversal pattern may be over within a week. Up-trends (or down-trends) may also be interrupted by a trading range before continuing the trend.
The model uses trendlines and breakouts above resistance levels to identify the start of a new trend.
Volume Confirmation
The breakout must be confirmed by higher than usual volume activity.
30 Week Moving Average
No trades may be entered if price is below the 30-week weighted moving average or if the moving average slopes downwards.
Trailing Sell-Stops
Stop-losses are moved up to below the Low of each successively higher trough in the up-trend or the 30-week MA, whichever is the lower. See Adjusting Stop Levels for details.
If the 30-week MA starts to level out and it appears that the stock is entering a Phase 3 top, then the stops are moved up to below the bottom of each successive trough and the 30-week MA is ignored.
Exit
Trailing sell-stops account for most of the exits from the trend. Exit immediately, however, if price falls below the 30-week MA and the MA is no longer rising.
Example
Yahoo is shown with 30-week weighted moving average.
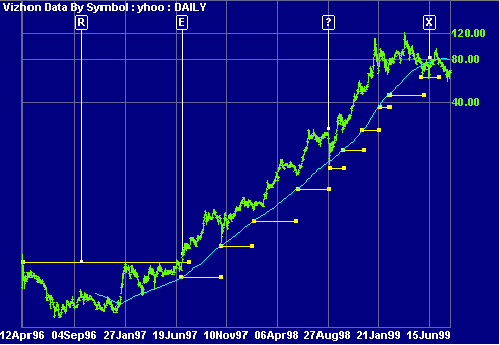
- Price breaks above the $3.00 resistance level [R] in June 1997. This is followed by a correction before a second breakout above the resistance which is confirmed by large volume. The entry point is marked by [E] and the 30-week MA is rising strongly.
- Stops (depicted by trendlines below the MA) are adjusted upwards as the trend progresses, but never above the 30-week MA as long as it is rising.
- Price crosses below the MA at [?] but the position is not closed as the MA is still rising.
- The position is stopped out at [X] when price falls below the previous stop level set just below $60.00.

Author: Colin Twiggs is a former investment banker with almost 40 years of experience in financial markets. He co-founded Incredible Charts and writes the popular Trading Diary and Patient Investor newsletters.
Using a top-down approach, Colin identifies key macro trends in the global economy before evaluating selected opportunities using a combination of fundamental and technical analysis.
Focusing on interest rates and financial market liquidity as primary drivers of the economic cycle, he warned of the 2008/2009 and 2020 bear markets well ahead of actual events.
He founded PVT Capital (AFSL No. 546090) in May 2023, which offers investment strategy and advice to wholesale clients.