Directional Movement v. Weinstein
An often-discussed system for tracking trends is the Directional Movement System set for weekly, rather than daily, directional movement. We compare performance to Stan Weinstein's breakout model, which combines a 30-week weighted moving average with trendlines and support/resistance.
Time Frames
Normal settings are 11-week Directional Movement. This is sometimes combined with Parabolic SAR to act as an additional filter. I have opted for a simpler system, entering on the next pull-back after the DI/ADX signal.
Trading Signals
DMS makes frequent whipsaws when not in a strong trend; so it is important to have an additional filter. My preference is Alexander Elder's system, where ADX must be rising before the signal is taken:
Go long when +DI is above -DI and either:
- ADX rises while +DI and ADX are above -DI; or
- ADX turns up from below +DI and -DI.
Exit when +DI crosses below -DI.
Go short when -DI is above +DI and either:
- ADX rises while -DI and ADX are above +DI; or
- ADX turns up from below +DI and -DI.
Exit when -DI crosses below +DI.
Further fine-tuning:
- Enter on the first pull-back (on the DI line) after the above signal;
- Exit if ADX turns down when above 50.
Example 1
Entry and exit signals from Stan Weinstein's breakout model ("SW") are plotted on the ASX All Ordinaries price chart below: [L] for long entries; [S] for short entries; and [X] for exits.
- [L] is a poor entry: a pull-back respects the new support level after the breakout (and above 30-week WMA) but later is stopped out at [X].
- The index respects resistance from the breakout and 30-week WMA at [S]. The exit point is debatable with such a sharp downward spike.
- [L] is just as late as the index rebounds in late 2001.
- Another good entry signal at [S2] when the pull-back respects resistance from the breakout and the 30-week WMA. The exit is slightly late at [L2].
- The long entry [L2] is taken when the index respects the WMA after breaking the downward trendline (not shown). This is a strong up-trend and the 30-week WMA keeps you in until the downward breakout at [X].
Compare the results to the 11-week Directional Movement System below the price chart.
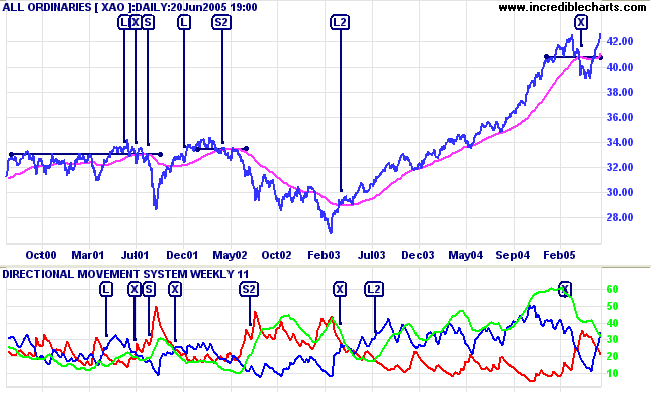
The filters help to avoid most of the whipsaws evident in
2000/2001 and again in mid-2002 and mid-2003.
Signals on the DMS indicator:
- [L] is earlier than SW but possibly more risky as it occurs prior to
breakout.
The exit point is similar (to SW). - The entry for [S] is identical: the first pull-back that respects the resistance line. The DMS exit is way too late; the index is already back at 3200.
- Entry for [S2] at 3200 is also a lot later than SW (when price forms a
double top below the resistance line at 3350).
Exit points are similar. - The long entry [L2] is again later than SW (when price forms a double-bottom above the 30-week WMA), though the exit comes up trumps as ADX turns down while above 50 right at the trend peak.
If we had to use the ADX filter (ADX > 25), the signals appear even later:
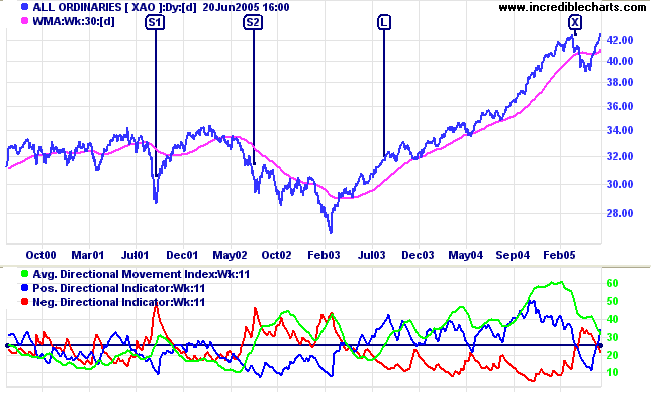
- [S1] is at the bottom of the sharp downward spike in 2001.
- [S2] is close to the dip below 3000.
- [L] is even slower than the highly reliable Coppock indicator.
Example 2
Entry and exit signals from Stan Weinstein's breakout model ("SW") are plotted on the Harvey Norman [HVN_AX] price chart below:
- [S1] is the first pull-back that respects both resistance at 4.00 and the 30-week WMA. Additional condfirmation is provided by the trendline.
- [S2] is a second entry point, respecting resistance at 3.20, the trendline and 30-week WMA.
- The exit occurs when price breaks the second trendline at [L].
- Go long at [L] when the second pull-back respects the 30-week WMA after breaking the downward trendlline.
- The stock enters an accelerating (blow-off) up-trend exposing an SW weakness: the exit [X] is late, almost 20% below the high.
- Price then forms a base before a long entry at [L2], possibly with a whipsaw just before. The exit is before [S3] when price falls below the WMA.
- Lastly [S3] provides a good short opportunity, with a pull-back that respects the trendline and 30-week WMA. The exit [X] is when HVN breaks the downward trendline.
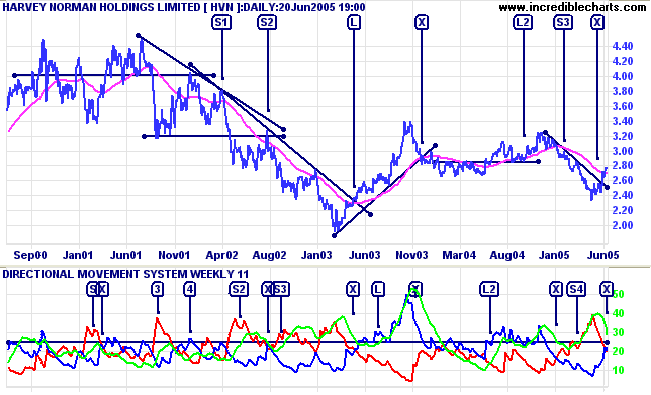
Signals on the DMS indicator:
- [S] provides a poor entry point at the bottom of a correction.
- Further poor entries at [3] and [4] are avoided as there was no pull-back on which to enter.
- [S2] is signaled at the start of a consolidation pattern. Stopped out by the short spike at [X].
- [S3] provides a better signal, on the pull-back after a downward breakout. The exit is similar to SW.
- The long entry [L] is again late but the exit signal comes up trumps: ADX turns down while above 50, straight after price has peaked.
- [L2] is a good early signal while the exit is similar to SW.
- [S4] is late.
Conclusion
Late Directional Movement signals are not compensated by increased reliability.
The one aspect of the DM system that I was impressed with was the ADX down-turn from above 50. It provides early signals for the expiry of strong trends, with roughly a 2:1 success rate when the signal occurs. Most of the misfires take you out of the trend too early; so it could be used as a signal to move your stops up to below each consecutive swing low (similar to how Stan Weinstein alters his stop-loss rules when the MA flattens out).
That may be a useful addition to Stan Weinstein's breakout model which is often exposed by late exits from blow-off trends. Despite this flaw, I have yet to find a better trend following system.