Directional Movement Index (DMI)
The Directional Movement Index is a fairly complex system developed by Welles Wilder and explained in his book, New Concepts in Technical Trading Systems.
Most indicators have one major weakness - they are not suited for use in both trending and ranging markets. The key feature of the DMI is that it first identifies whether the market is trending before providing signals for trading the trend.
Directional Movement Index measures the ability of bulls and bears to move price outside the previous day's trading range. The system consists of three lines:
- The Positive Direction Indicator (+DI) summarizes upward trend movement;
- The Negative Direction Indicator (-DI) summarizes downward trend movement; and
- The Average Directional Movement Index (ADX) indicates whether the market is trending or ranging.
Welles Wilder does not use the standard moving average formula. This should be taken into account when selecting indicator time periods. See Welles Wilder Moving Average.
Directional Movement Index Trading Signals
A number of different trading systems have developed around Directional Movement. The following rules are based on the system presented by Dr Alexander Elder in Trading for a Living:
Go long when +DI is above -DI and either:
- ADX rises while +DI and ADX are above -DI; or
- ADX turns up from below +DI and -DI.
Exit when +DI crosses below -DI.
See ADX below for further details.
Go short when -DI is above +DI and either:
- ADX rises while -DI and ADX are above +DI; or
- ADX turns up from below +DI and -DI.
Exit when -DI crosses below +DI.
Use stop-losses at all times.
ADX:
Declining ADX shows that the market is losing direction. When ADX falls below both +DI and -DI it signals a lifeless market. Do not trade with DMS until ADX has clearly turned off the bottom. Dr Elder suggests waiting until ADX rises 4 steps off its low (e.g. ADX rises to 19 from a low of 15). The longer that ADX has remained below both +DI and -DI the stronger the subsequent trend is likely to be.
When ADX rises above both +DI and -DI it signals that the market is becoming overheated. Take profits when ADX turns downwards from above +DI and -DI.
Example
The Commonwealth Bank of Australia Limited is plotted with 14-day +DI, -DI and ADX.
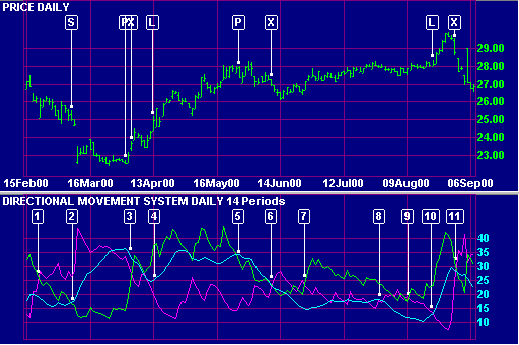
Mouse over chart captions to display trading signals.
- -DI crosses to above +DI so trade only short.
- Go short when ADX rises above +DI.
- Take profits when ADX turns down while above +DI and -DI.
Exit short trade and trade only long as +DI has crossed to above -DI. - Go long as ADX starts rising while above -DI.
- Take profits when ADX turns down while above +DI and -DI.
- Exit long trade and trade only short as -DI has crossed to above +DI.
ADX continues to fall so there are no trades. - Trade only long as +DI has crossed to above -DI.
ADX turns up while below +DI and -DI, but does not rise by the recommended 4 steps, so no trade is entered. - One view is that you should go long whenever ADX rises above -DI, but ADX has remained very low and flat and it would be advisable not to trade until ADX has risen by at least 4 steps above its recent low.
- Trade only long as +DI has crossed to above -DI.
- Go long when ADX rises above -DI.
- Exit long trade when +DI falls below -DI.
Setup
The default Directional Movement Index uses 14 day smoothing. This is not equivalent to a 14 day EMA. See Wilder Moving Average for details.
Edit Indicator Settings explains how to alter the default settings. Indicator Panel shows how to set up an indicator.
DMI Formula
To calculate the Directional Movement Index:
- Calculate the Directional movement for today
+DM = Today's High - Yesterday's High (when price moves upward)
-DM = Yesterday's Low - Today's Low (when price moves downward)
You cannot have both +DM and -DM on the same day. If there is an outside day (where both calculations are positive) then the larger of the two results is taken. An inside day (where both calculations are negative) will always equal zero. - Calculate the
true range for the day. True range is the largest of:
Today's High - Today's Low,
Today's High - Yesterday's Close, and
Yesterday's Close - Today's Low - +DM14 = exponential moving
average* of +DM
- -DM14 = exponential moving
average* of -DM
- TR14 = exponential moving
average* of True Range
Next, calculate the Directional Indicators: - +DI14 = +DM14 divided by TR14
- -DI14 = -DM14 divided by TR14
Then, calculate the components of the Average Directional Movement Index (ADX): - Calculate the DI Difference:
Record the difference between +DI14 and -DI14 as a positive number. - Calculate the Directional Index (DX):
DX = DI Difference divided by the sum of +DI14 and -DI14 - ADX = the exponential
moving average* of DX
*Welles Wilder's Indicators
Users should beware, when setting time periods for Welles Wilder's indicators, that he does not use the standard exponential moving average formula. See wilder moving averages
We recommend that users try shorter time periods when using one of the above indicators. For example, if you are tracking a 30-day cycle you would normally select a 15-day Indicator Time Period. With the Directional Movement, adjust the time period as follows:
Directional Movement time period = (n + 1) / 2 = (15 + 1) / 2 = 8 days

Author: Colin Twiggs is a former investment banker with almost 40 years of experience in financial markets. He co-founded Incredible Charts and writes the popular Trading Diary and Patient Investor newsletters.
Using a top-down approach, Colin identifies key macro trends in the global economy before evaluating selected opportunities using a combination of fundamental and technical analysis.
Focusing on interest rates and financial market liquidity as primary drivers of the economic cycle, he warned of the 2008/2009 and 2020 bear markets well ahead of actual events.
He founded PVT Capital (AFSL No. 546090) in May 2023, which offers investment strategy and advice to wholesale clients.