Projects Explained
Projects contain a set of indicators, trendlines, captions and default settings. They do not contain data for specific securities. All data is stored in a central folder so that you can access securities from any open project.
Advantages
The primary purpose of projects is to separate daily, weekly and monthly views. Each project can be set with its own default view and indicator settings.
Projects also enable you to create:
- More than one trading system;
- Separate indicator studies; and
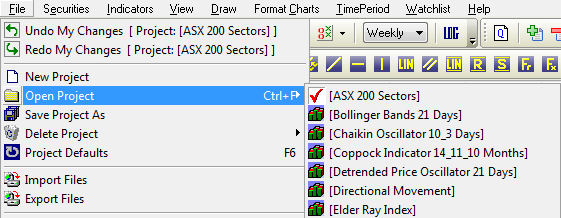
- Studies specific to a key index or security (see My Favorites below).
And pre-set files [in square brackets] save time setting up [Multiple Moving Averages] and other complex indicators.
Default Project
Incredible Charts always opens with the Default project file. We suggest that you use this for your most popular settings.
Time Frames
I use the Default project for my short time frame and others for longer periods:
| Project Name | Time Frame | Indicators | |
| Default | 3 months | Volume (daily); Twiggs Money Flow (21) | |
| Daily | 6 months | Volatility Ratio (Schwager 21); Twiggs Money Flow (21) | |
| Intermediate | 18 months | EMA (100); Volume (weekly); Twiggs Money Flow (21) | |
| Weekly | 5 years | EMA (100); Volatility (63); Twiggs Money Flow (21); AD | |
| Monthly | 10 years | EMA (100); Volatility (63); Twiggs Money Flow (21); AD |
My Favorites
Apart from separate time frames, I use several specialized projects:
| Project Name | Default Settings | |
| P&F | Point & Figure, box size 5, reversal 2; | |
| P&F Index | Point & Figure, box size 1, reversal 2; | |
| EQV | Equivolume, 3 months; | |
| Sectors | Sector Analysis; | |
| Gold & Oil | Gold-oil ratio, 30 years, data imported from disk; | |
| Yields | 10-year T-Note Yield and Price Differential with 13-week T-Bills; | |
| Wright | Wright model, 25 years, US Fed data imported from disk. |
Project Defaults [F6]
Use the F6 shortcut key or View >> Project Defaults to set default views for each project and make browsing easier.
- Only set a default security if you want it to display each time you open
the project
(examples: d_gold in my Gold & Oil project, and tnx_in in the Yields project); - Time period;
- Chart interval (i.e. Daily, Weekly or Monthly bars; Equivolume; or Point & Figure settings);
- Price scale: log or normal;
- Chart type: OHLC, Candlesticks or Closing Price.
See Project Defaults for further details.
Next: Creating Projects