Point and Figure Chart Patterns
Basic Point and Figure Chart Patterns
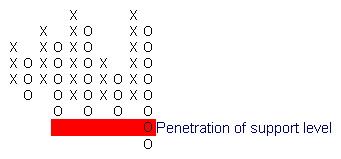
Point and Figure: Support Levels
Support levels are price levels at which large numbers of buyers are expected to enter the market. They are easily identified on Point and Figure charts by 2 or more columns of O's bottoming out at the same level.
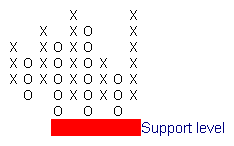
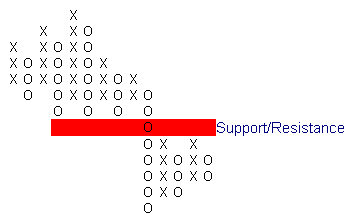
When penetrated, support levels often become resistance levels.
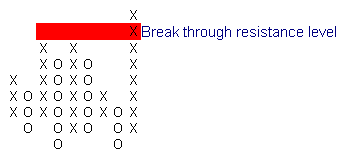
Point and Figure: Resistance Levels
Resistance levels are prices at which large numbers of sellers are expected to enter the market. You can identify them on Point and Figure charts by 2 or more columns of X's ending with equal tops.
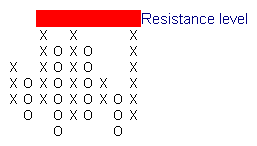
When penetrated, resistance levels often become future support levels.
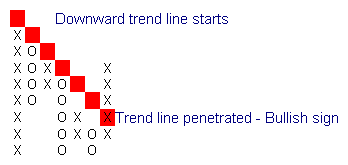
Point and Figure: Trendlines
Trend lines on Point and Figure charts are plotted at an angle of 45 degrees (one square across and one up/down).
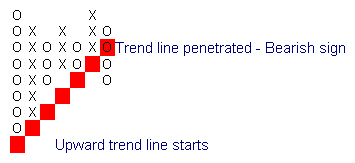
An up-trend will always be first penetrated by a column of O's and a down-trend by a column of X's.
Point and Figure Breakouts
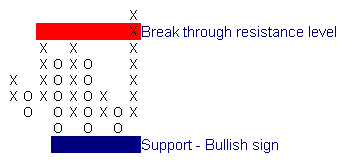
Breakout above a resistance level is a bullish signal.
Penetration of a support level is generally bearish.
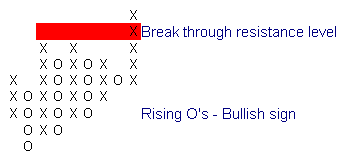
Point and Figure: Bullish and Bearish Signs
When you encounter penetration of a support or resistance level, examine the Point and Figure chart carefully for supporting evidence. The following Point and Figure pattern of rising columns of O's gives further confirmation of the breakout.
The next Point and Figure pattern shows a strong support base for the breakout — still a bullish signal.
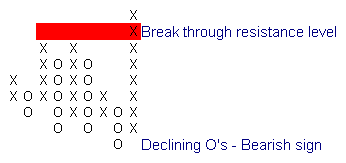
But the next Point and Figure pattern hints of a weak breakout that may result in a bull trap.
The same Point and Figure patterns can be identified with support level penetrations. Is the following penetration of the support level likely to hold?
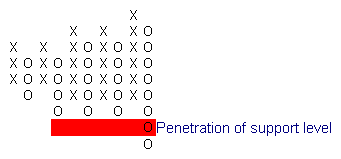
Rising Point and Figure columns of X's signal weakness - be on the alert for a bear trap.
Advanced Point and Figure Chart Patterns
There are a number of Point and Figure chart patterns that may span a wider number of columns:
- Point and Figure Bull & Bear Traps
- Point and Figure Cup & Handle
- Point and Figure False Breaks
- Point and Figure Retracements
- Point and Figure Spikes
- Point and Figure Trend Reversals
- Point and Figure Triangles
Point and Figure Chart Types
Always bear in mind that varying Point and Figure box sizes and reversal amounts may result in different chart patterns. As would varying Point and Figure chart methods:

Author: Colin Twiggs is a former investment banker with almost 40 years of experience in financial markets. He co-founded Incredible Charts and writes the popular Trading Diary and Patient Investor newsletters.
Using a top-down approach, Colin identifies key macro trends in the global economy before evaluating selected opportunities using a combination of fundamental and technical analysis.
Focusing on interest rates and financial market liquidity as primary drivers of the economic cycle, he warned of the 2008/2009 and 2020 bear markets well ahead of actual events.
He founded PVT Capital (AFSL No. 546090) in May 2023, which offers investment strategy and advice to wholesale clients.