Point and Figure Retracements
Retracement Chart Patterns
Retracements (or corrections), during a Point and Figure trend, tell us about the strength of the trend. There are three main categories in an up-trend, while the converse applies to a down-trend.
Short Retracement
If the retracement is short and reverses above the previous high, this signals both an absence of selling pressure and/or commitment from buyers. Expect a strong up-trend.
Respects Support
If a retracement ends at the first level of support, the previous high, this signals commitment from buyers. While not as strong as a short retracement, expect a healthy up-trend.
Example
A strong up-trend on Yahoo displays a number of short retracements, reversing at or above the first support level (from the previous high).
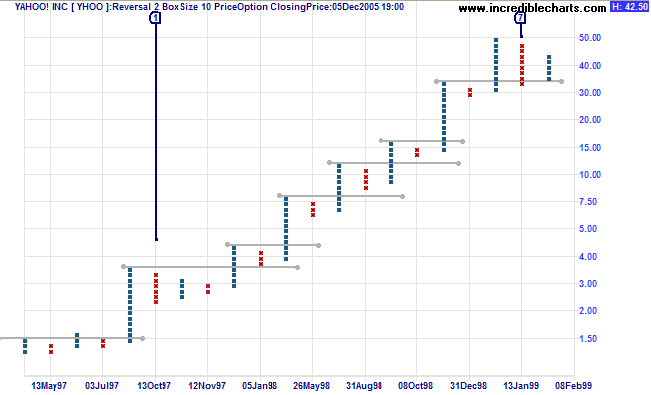
Also note the triangle at [1] and the false break below the previous low at [7].
Long Retracement
A long retracement, especially when it follows a spike, signals trend weakness. Higher prices may be unsustainable and we need to look out for a short reaction followed by a change of trend.
The same applies to a long retracement following a downward spike: lower prices are unsustainable.
Example
The All Ordinaries displays a recent example of a downward spike followed by rapid retracement and a subsequent trend-change.
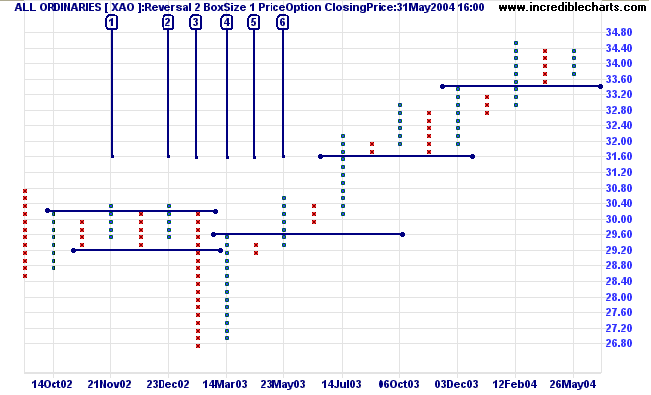
- False break above the previous high in a down-trend.
- Equal high confirms resistance.
- Downward spike.
- Strong retracement.
- A short reaction follows: only two Xs.
- A break above the previous column of Xs confirms the trend change.

Author: Colin Twiggs is a former investment banker with almost 40 years of experience in financial markets. He co-founded Incredible Charts and writes the popular Trading Diary and Patient Investor newsletters.
Using a top-down approach, Colin identifies key macro trends in the global economy before evaluating selected opportunities using a combination of fundamental and technical analysis.
Focusing on interest rates and financial market liquidity as primary drivers of the economic cycle, he warned of the 2008/2009 and 2020 bear markets well ahead of actual events.
He founded PVT Capital (AFSL No. 546090) in May 2023, which offers investment strategy and advice to wholesale clients.