Point and Figure False Breaks
False Break Chart Patterns
Similar to bull and bear traps, false (or marginal) breaks occur at minor Point and Figure support levels (from a previous low) or minor resistance levels (from a previous high). They should only be traded in an established trend.
Point and Figure Up-Trend
In a Point and Figure up-trend, if price falls below the previous low by only a small margin (normally only one box) and then promptly reverses upwards, buy on recovery above the previous low.
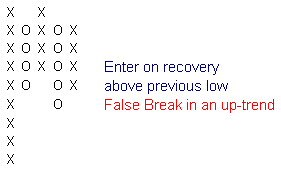
A possible weakness of Point and Figure charts: you will not see the recovery until price has increased by the reversal amount.
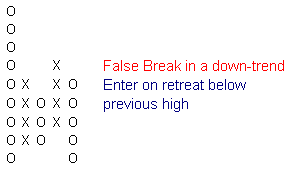
Point and Figure Down-Trend
The same applies to down-trends. If price rises above the previous high by a small margin and then promptly reverses, buy on the retreat below the previous high.

Author: Colin Twiggs is a former investment banker with almost 40 years of experience in financial markets. He co-founded Incredible Charts and writes the popular Trading Diary and Patient Investor newsletters.
Using a top-down approach, Colin identifies key macro trends in the global economy before evaluating selected opportunities using a combination of fundamental and technical analysis.
Focusing on interest rates and financial market liquidity as primary drivers of the economic cycle, he warned of the 2008/2009 and 2020 bear markets well ahead of actual events.
He founded PVT Capital (AFSL No. 546090) in May 2023, which offers investment strategy and advice to wholesale clients.