Point and Figure Charts: Triangles
Triangle Chart Patterns
For a valid Point and Figure triangle there must be at least two retracements counter to the prevailing trend: two falling columns of Os in an up-trend or two rising columns of Xs in a down-trend.
Symmetrical
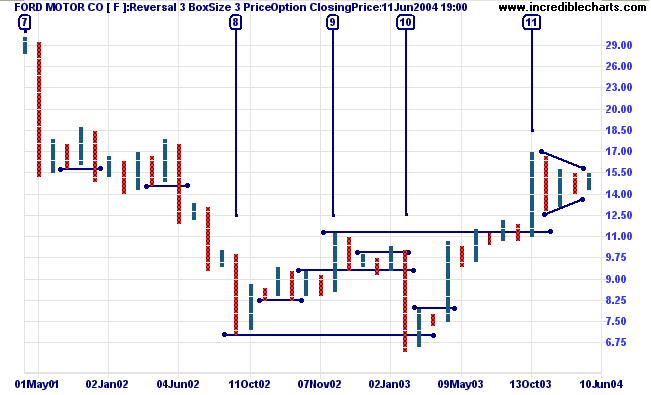
Ford [F] presents an example of a symmetrical triangle at [11] on the chart below.

The Point and Figure chart also presents a good example of a wide bear trap at [10].
Ascending & Descending Triangles
You will also find (bullish) ascending and (bearish) descending triangles on Point and Figure charts.

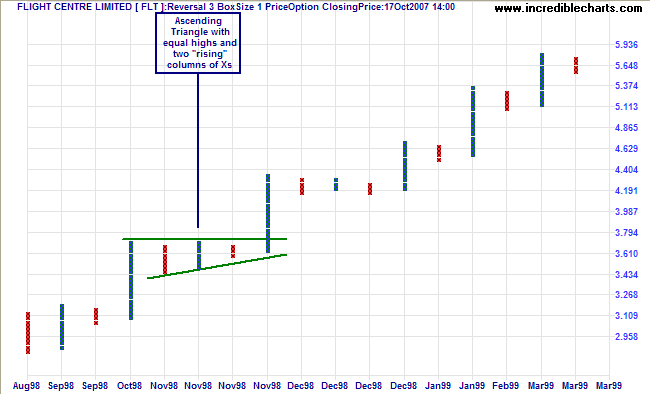
Flight Centre (Australia) presents a good example of a bullish ascending triangle on the Point and Figure chart, with equal highs and two ascending columns of Xs (with higher lows).

Author: Colin Twiggs is a former investment banker with almost 40 years of experience in financial markets. He co-founded Incredible Charts and writes the popular Trading Diary and Patient Investor newsletters.
Using a top-down approach, Colin identifies key macro trends in the global economy before evaluating selected opportunities using a combination of fundamental and technical analysis.
Focusing on interest rates and financial market liquidity as primary drivers of the economic cycle, he warned of the 2008/2009 and 2020 bear markets well ahead of actual events.
He founded PVT Capital (AFSL No. 546090) in May 2023, which offers investment strategy and advice to wholesale clients.
