Point and Figure Spikes
Spike Chart Patterns
Point and Figure Up-Trend
An upward Point and Figure spike, where a rally exceeds the previous column of Xs by at least 10 boxes. This is a signal to take profits: spikes can reverse sharply and there is nothing worse than seeing those hard-earned profits disappear before your eyes.
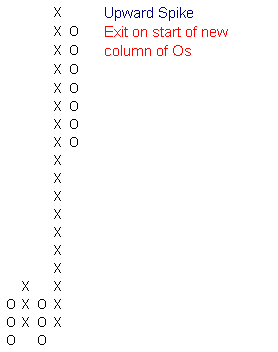
Occasionally you will be lucky enough to experience two/more spikes in succession; so be on the lookout for a short pull-back (no more than say 3 boxes). Re-enter if there is a short retracement followed by a breakout above the previous high. Keep stops tight.
Point and Figure Down-Trend
Thomas Dorsey (Point & Figure Charting) mentions a long tail down pattern, where a single column of Os is 20 or more boxes, which he uses as a buy signal. I would not be that adventurous. I suspect that successive downward spikes are more common than successive upward spikes. If, however, a column of Os exceeds the previous trough by at least 10 boxes, it is clearly a signal to take profits on short positions. Exit on the start of a new column of Xs.
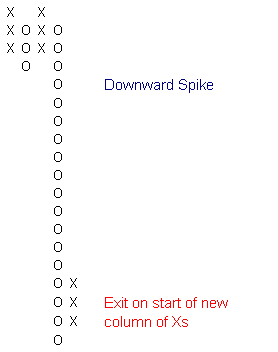
Re-enter if there is a short retracement followed by a breakout below the previous low. Keep stops tight.
Pattern Failure
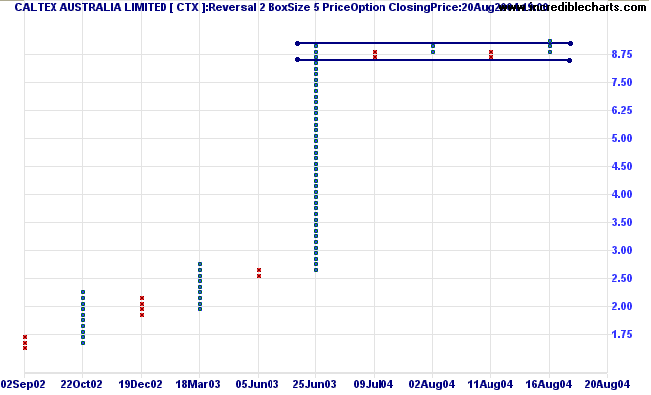
At times we are all confronted with situations like this: Caltex Australia [CTX] failed to correct sharply on the Point and Figure chart as expected. Instead it formed a narrow consolidation after a tall spike, before breaking out on the upside.
A narrow consolidation is a bullish sign in an up-trend. There are two options:
- Re-enter during the consolidation; or
- Enter on the breakout above the previous high.
Stops can be placed below the lower border of the consolidation.

Author: Colin Twiggs is a former investment banker with almost 40 years of experience in financial markets. He co-founded Incredible Charts and writes the popular Trading Diary and Patient Investor newsletters.
Using a top-down approach, Colin identifies key macro trends in the global economy before evaluating selected opportunities using a combination of fundamental and technical analysis.
Focusing on interest rates and financial market liquidity as primary drivers of the economic cycle, he warned of the 2008/2009 and 2020 bear markets well ahead of actual events.
He founded PVT Capital (AFSL No. 546090) in May 2023, which offers investment strategy and advice to wholesale clients.