How to Trade Candlestick Patterns
Trading Candlesticks on their own may not be that reliable. You need to use all the information provided by the chart. To improve accuracy, combine:
Candlesticks accentuate the relationship between opening and closing prices — the body of the candlestick. The shadow of the candlestick, however, is just as important. Spikes often precede a (short-term) trend change and wide ranging days or gaps are as important as Volume in identifying signal strength. I find it useful to display Volatility Ratio (preferably the 14-day Schwager option) below the candlestick chart to highlight days with unusual Volatility. The indicator uses true range, so both wide ranging days and gaps are reflected by high values.

The importance of Volume in highlighting unusual trading activity cannot be over-emphasized, but candlestick signals should also be considered against the broader context of support and resistance levels. Finally, trendlines measure market momentum; and trendline breaks offer further advance warning of trend changes.
Candlesticks Example
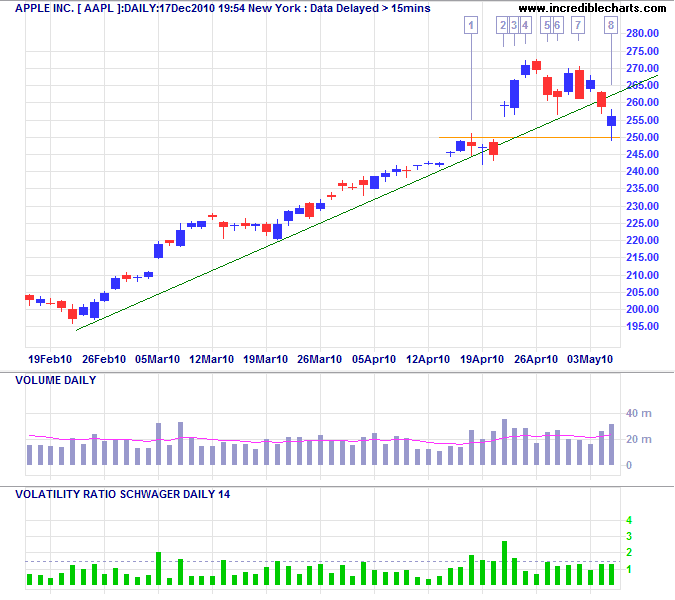
Apple Inc [AAPL] displayed with Candlesticks, Volume (with 14-day exponential moving average), Volatility Ratio (14-day with signal line at 1.50), Support/Resistance, and Trendlines. Readers will observe the breakaway in early March accompanied by strong volatility and volume, but this example focuses on activity around the $250 level in April.

- After breaking out above $200 AAPL establishes a healthy up-trend. A volume spike highlights the long-legged doji at 250, signaling increased selling pressure at the resistance level. A dragonfly candlestick the next day, also with higher than normal volume, indicates buying pressure. A red candlestick follows, but high volume indicates the continued presence of buyers. Narrow consolidation below resistance is a powerful continuation signal.
- Volatility highlights the large gap through resistance. Breakout would normally be taken as the start of a fresh advance but the doji candlestick accompanied by strong volume warns that this could be an exhaustion gap.
- Follow-through with a strong blue line suggests that buyers are back in control.
- Continued high volume and an evening star candlestick pattern warns that sellers are making a comeback.
- A stronger red candlestick completes the evening star pattern, warning of a reversal.
- Strong volume the next day accompanied by a hammer candlestick, however, warns of a reversal.
- Price rallies to 270 but is followed by bearish engulfing candlestick. Low volume reduces the significance, however. A harami candlestick follows, indicating further hesitancy.
- The rising trendline is again penetrated, but this time there is follow-through, warning that the up-trend is losing momentum. The decline threatens to close the earlier gap, completing an island cluster reversal. Strong volume and a long-tailed candlestick, however, suggest buying pressure at the 250 support level.

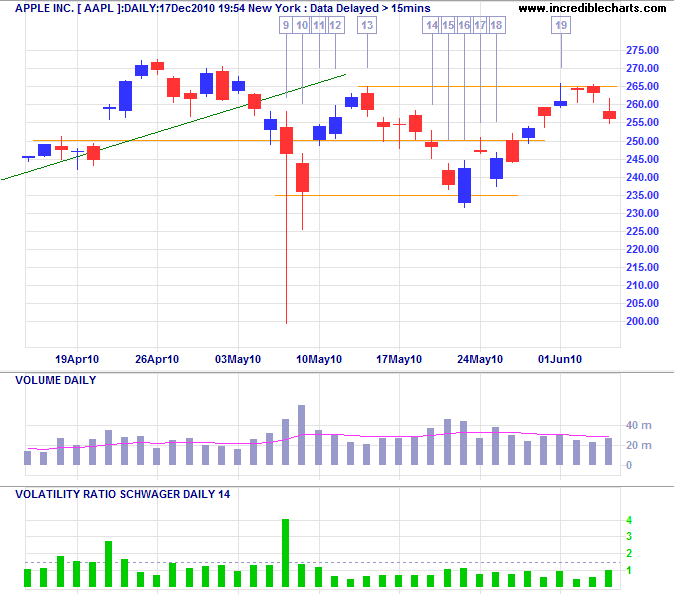
- Sellers who hesitated after the trendline break were caught in a classic shakeout when short-term traders managed to drive price below 250, unearthing a large number of stops. Price fell dramatically as brokers struggled to fill sell orders before the insiders re-entered the market at 200, snapping up bargains and driving price back to 250. Strong volume and the size of the candlestick tail both telegraph strong buying support.
- Even stronger volume accompanying another long tail establish support at 235.
- A short body with strong volume in the evening star candlestick position warns that sellers remain present in numbers.
- More strong volume and a weaker close strengthen the signal.
- A short body suggests continued resistance, especially when followed by a bearish engulfing candlestick.
- Price breaks short-term support at 250, but rising volume and a long-legged doji candlestick indicate hesitancy.
- Price gaps down but a short body and strong volume suggest buying support at 235.
- A bullish engulfing candlestick confirms buying pressure.
- A doji at 250, in the evening star position suggests further uncertainty.
- A stronger body and rising volume, however, signify buying support.
- Price rallies back to resistance at 265, where rising volume and a gravestone candlestick warn of selling pressure. When price reverses it is clear that AAPL is trapped in a large consolidation, with strong buying support at 235 but large numbers of sellers taking profits between 265 and 275. The ranging market continued until September 2010.
Candlesticks Evaluation
Candlesticks should not be used in isolation to generate trading signals. There are too many other factors that impact on price. But candlesticks are helpful, when used in conjunction with volume and volatility, to evaluate behavior at major support, resistance and trendline breaks.

Author: Colin Twiggs is a former investment banker with almost 40 years of experience in financial markets. He co-founded Incredible Charts and writes the popular Trading Diary and Patient Investor newsletters.
Using a top-down approach, Colin identifies key macro trends in the global economy before evaluating selected opportunities using a combination of fundamental and technical analysis.
Focusing on interest rates and financial market liquidity as primary drivers of the economic cycle, he warned of the 2008/2009 and 2020 bear markets well ahead of actual events.
He founded PVT Capital (AFSL No. 546090) in May 2023, which offers investment strategy and advice to wholesale clients.
