Rectangle Pattern
Rectangles are one of the most reliable chart patterns when they appear in close proximity to support or resistance during an uptrend. Narrow rectangles are formed by support and resistance close together. This also applies to other short-term patterns such as pennants.
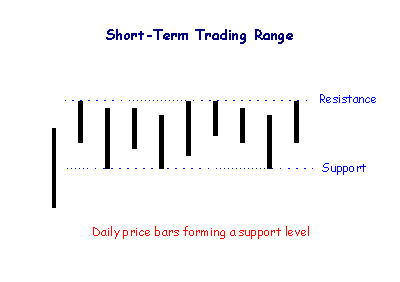
Rectangles signal accumulation when they occur in an up-trend and distribution in a down-trend and are traded in a similar fashion to flags and pennants.
Rectangle Pattern: Bull and Bear Signals
In an Up-trend
- One of the best bull signals you will find is where a narrow rectangle forms immediately below major resistance. Buying support is strong enough to prevent a retracement and normally it is only a matter of time before a breakout.
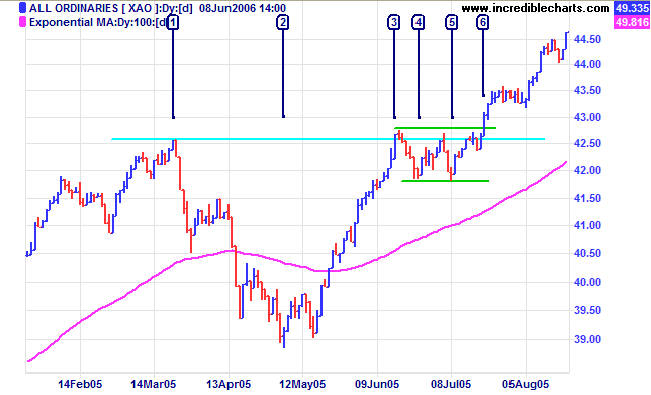
- A rectangle that forms immediately after a breakout, above the former resistance level, is also bullish. Buyers and sellers are evenly matched, but support is likely to outlast resistance, resulting in an upward continuation. However, the pattern is more prone to failure: a close below the former resistance level is a bearish sign.
In a Down-Trend
- A narrow rectangle that forms above support is a strong bear signal. Sellers are preventing a rally and support will most likely fail.
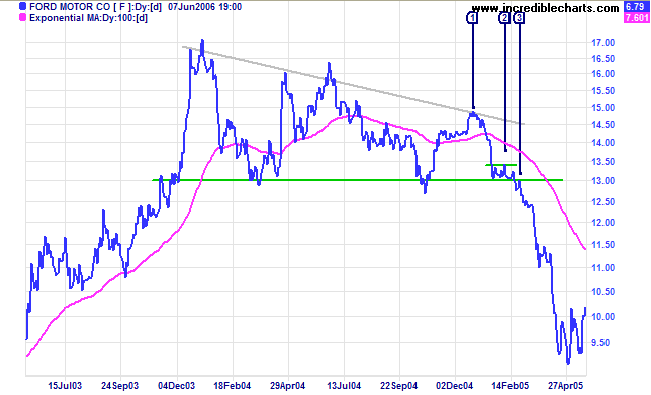
- A rectangle that forms immediately below a former support level is also bearish, but more prone to failure: close back above the former support level may be a bear trap.
Volume Confirmation

Volume should decline during the consolidation and spike up at the breakout. Note, after the breakout, how volume also declines on retracement back to the new resistance level at $13.00 and spikes upward on the reversal.

Author: Colin Twiggs is a former investment banker with almost 40 years of experience in financial markets. He co-founded Incredible Charts and writes the popular Trading Diary and Patient Investor newsletters.
Using a top-down approach, Colin identifies key macro trends in the global economy before evaluating selected opportunities using a combination of fundamental and technical analysis.
Focusing on interest rates and financial market liquidity as primary drivers of the economic cycle, he warned of the 2008/2009 and 2020 bear markets well ahead of actual events.
He founded PVT Capital (AFSL No. 546090) in May 2023, which offers investment strategy and advice to wholesale clients.