Flag and Pennant Patterns
Flags and pennants are short-term congestion patterns (one to five weeks) that form in trends. They represent pauses while a trend consolidates and are reliable continuation signals in a strong trend.
Flags
A flag is formed when parallel lines can be drawn through the peaks and the troughs in a correction (or a rally during a down-trend). The lines slope counter to the direction of the trend. The pattern is completed by a break outside the parallel lines.
Jack Schwager (Schwager on Futures - Technical Analysis) says that he finds flags that slope in the direction of the trend (rather than counter to the trend) just as reliable. There are many traders who would not agree with this.
Example
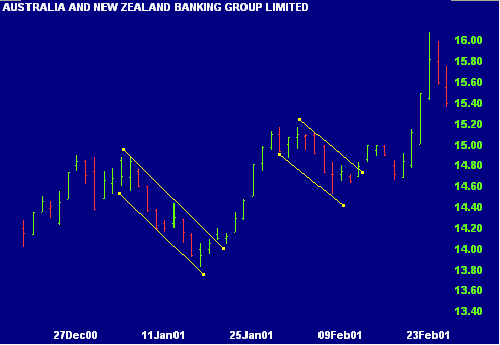
ANZ is in the middle of a strong up-trend. Two flags are marked on the chart. Lines through the peaks and the lines through the troughs are parallel and counter to the direction of the trend.
Example
Telstra Corporation Limited (Australia) in a strong down-trend.
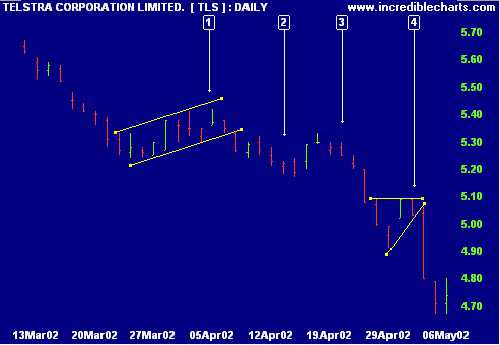
- A flag forms with parallel lines counter to the down-trend.
- Try to identify the flag or pennant between [2] and [3].
- This will give you an idea of how subjective pattern identification can be.
- The last pattern is a pennant.
Pennants
Pennants are really short-term triangles. They form with lower highs and higher lows, over one to five weeks. The line through the peaks and the line through the troughs converge and the pattern is completed by a break outside the converging lines.
Example
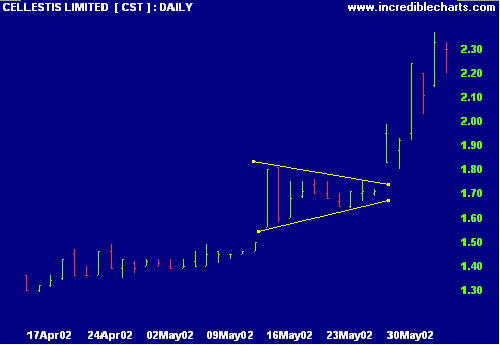
Cellestis Limited (Australia) illustrates a pennant during a recent up-trend. The upper and lower lines converge to form a short-term triangle, completed by price gapping above the upper pennant line.
Volume Confirmation
Volume normally expands at the start of the flag or pennant, contracts as the pattern develops and then expands on the breakout.
Target Measurement
In an up-trend, the targeted move is measured from the start point of the trend (the breakout point at the base of the trend or most recent congestion pattern) to the highest high recorded in the flag or pennant pattern. The move is then projected up from the point of breakout (from the flag or pennant pattern), to arrive at the target.
Example
The All Ordinaries (Australia) exhibited a pennant during a strong up-trend in October 2001.
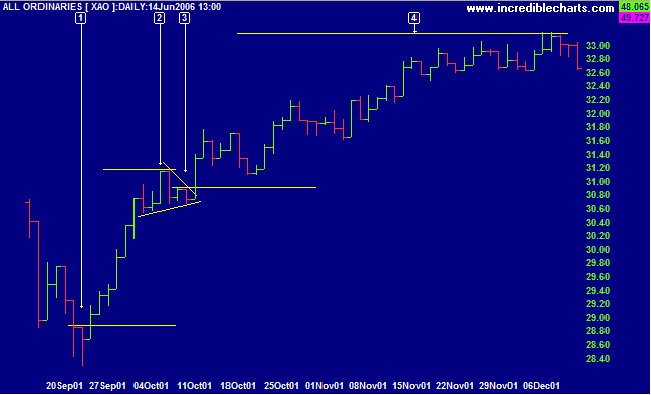
- The targeted move is measured from the high of the lowest day in the "V" bottom.
- The upper boundary of the targeted move is the highest high
recorded within the pennant.
Move = 3114 - 2885 = 229 - The distance from [1] to [2] is then projected from the point of breakout (when price rose above the high of day [3]).
- The target is calculated as the move plus the value at the
breakout point:
Target = 3088 + 229 = 3317
In a down-trend, the targeted move is measured from the start of the down-trend (the breakout point from the reversal or most recent congestion pattern). The distance is calculated to the lowest low recorded in the flag or pennant pattern and then projected down from the point of breakout (from the flag or pennant pattern).
Trading Signals
There are two schools of thought:
(A) The first school will enter a trade at the point of breakout and place a stop-loss one tick outside the opposite trendline.
In an up-trend, the trade is entered on a break above the upper flag or pennant line. The stop is placed just below the lower flag or pennant line, in line (vertically) with the point of breakout.
In a down-trend, the trade is entered on a break below the lower flag or pennant line, with a stop placed one tick above the upper flag or pennant line, opposite the breakout point.
(B) The second school will enter a trade before the breakout point, while the pattern is still forming. Their reasoning is that the patterns are normally reliable and early entry means lower risk, as the stop is closer to the entry point. This is only makes sense for pennants, not for flags where there is no technically reliable point to place a stop-loss.
For pennants, place a stop-loss just outside the trendline, in line (vertically) with the point of entry, on the opposite side to the expected breakout.
Example
Southcorp Limited (Australia) forms a pennant at the upper end of a trading range and then forms a second pennant after the breakout.
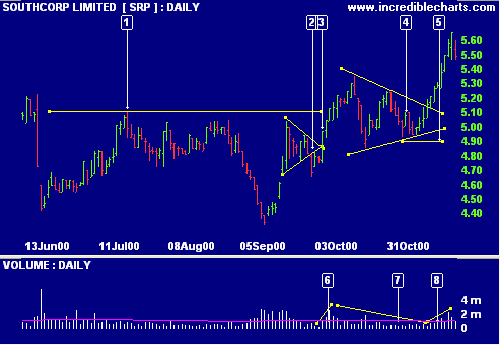
- The stock encounters resistance at [1] before making a further trough in September - a promising double bottom.
- A pennant forms below the resistance line - a strong bullish signal as the stock has entered a congestion pattern rather than a correction. The breakout at [2] is in the opposite direction to that expected.
- Within 4 days the breakout has turned into a bear trap, with a break above the pennant at [3].
- A larger pennant forms straddling the resistance line - another strong bullish signal. A long position is entered on day [4], when price respects the bottom trendline.
- A stop-loss is placed below the trendline, in line with the previous trough. The stop is indicated by a horizontal trendline at [5]. Price again tests the lower trendline but fails to activate the stop, before making a strong breakout to form a new high.
- Volume is not text-book perfect, but expands at the start of the large pennant.
- Volume then contracts as the pennant forms.
- Finally, volume expands at the breakout.

Author: Colin Twiggs is a former investment banker with almost 40 years of experience in financial markets. He co-founded Incredible Charts and writes the popular Trading Diary and Patient Investor newsletters.
Using a top-down approach, Colin identifies key macro trends in the global economy before evaluating selected opportunities using a combination of fundamental and technical analysis.
Focusing on interest rates and financial market liquidity as primary drivers of the economic cycle, he warned of the 2008/2009 and 2020 bear markets well ahead of actual events.
He founded PVT Capital (AFSL No. 546090) in May 2023, which offers investment strategy and advice to wholesale clients.