Getting Started: Stock Screener
Here is a brief example of how to find trending stocks.
Open the Stock Screener
- Select Securities >> Stock Screens on the chart menu; or
- click
 on the toolbar.

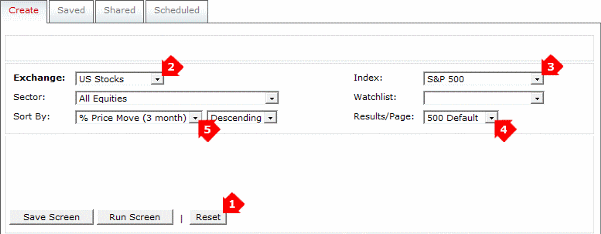
Select the Exchange and Index
- Click the Reset button to clear any existing filters;
- Select the Exchange
- Select the Index or Watchlist (optional)
- Increase Results/Page if there are likely to be many returns
- Sort By will order results by ascending or descending Stock name, Symbol or % Price Move

Set the Moving Average Filter
Filter for stocks that are above their 100-day exponential moving average:
- Select Moving Average (Exponential)
- Choose a fast moving average or Close (for closing price)
- Select Above (bull signal) or Below (bear signal)
- Choose a slow moving average (100-day in the example)
- To identify recent cross overs, select Within.
Select Exclude to identify established trends where the fast MA remains above (or below) the slow MA for a minimum period. - Select the number of trading days to include (within) or exclude.
All captures all stocks above (or below) the MA. - Click the Add button, then Run Screen.

Established Trends
Click on the MA header to order from the highest days above the MA to the lowest.

These are strong trending stocks. Entry opportunities often present themselves when stocks dip back to the moving average and the 3-month % price move is low.
New Trends
Click on the MA header to reverse the order.

Prices often whipsaw around the moving average and stocks should be treated with caution where closing price has been above the moving average for less than 20 days. However, new trends can sometimes be identified by high 3-month % price moves.
View Chart from Stock Screen
- Double-click on a stock; or
- Right-click and select Chart the Selected Security.

Scroll Charts on Stock Screen
To scroll the stock screen list select Scroll Stockscreen on the toolbar, then:
- Use the yellow arrows on the chart toolbar, or
- Right-click the down arrow and select a stock from the list.

Save to a Watchlist
To add a stock to your watchlist:
- Click the watchlist icon on the chart toolbar.

Save Stock Screen as a Watchlist
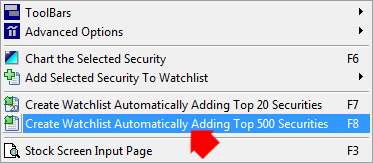
You can save up to 500 stocks as a new watchlist. On the Stock Screen's results page:
- Use the F8 shortcut key; or
- Right-click on the stock screen and select Create Watchlist Automatically Adding Top 500 Securities.

That should be sufficient to get you started. Click on the Help or FAQ links (below or on the top menu bar) if you have further questions.
