Trading Diary
July 2, 2005
These extracts from my daily trading diary are
for educational purposes and should not be interpreted as
investment advice. Full terms and conditions can be found at
Terms
of Use.
USA
The Dow Industrial Average has found short-term support at 10300, but strong volume [4] on Thursday and a weak close [5] on Friday signal that this is unlikely to hold. Lower volume on Friday can be attributed to the long weekend. Expect a test of support at 10000.
The Dow Industrial Average has found short-term support at 10300, but strong volume [4] on Thursday and a weak close [5] on Friday signal that this is unlikely to hold. Lower volume on Friday can be attributed to the long weekend. Expect a test of support at 10000.
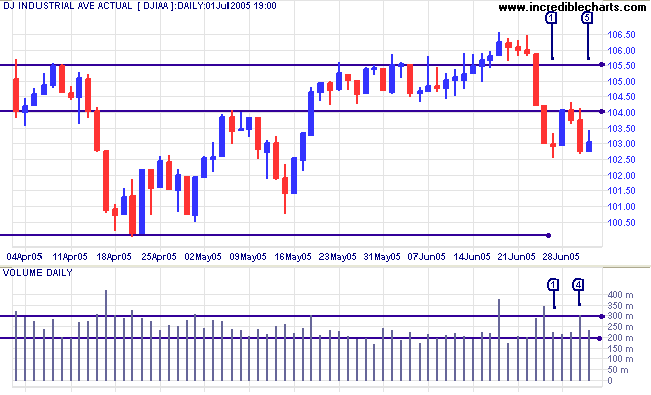
Twiggs Money Flow (21-day) bearish
divergence confirms the likelihood of a test of 10000. In the
longer term the indicator is oscillating around the zero line
(with fairly symmetrical peaks and troughs) and not showing much
direction.
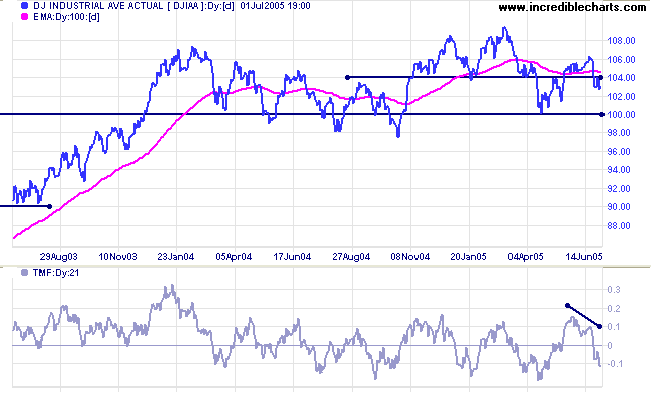
The primary down-trend has so far lacked momentum (indicated by the break back above the first line of resistance at 10400) because of strong support at 10000. A close below 10000 may change this. Confirmation of a strong primary down-trend could come from a pull-back that respects a new resistance level at 10000, or a fall below 9750, the October 2004 low.
On the other hand, if support at 10000 holds, accompanied by strong volume or a false break that is quickly recovered, expect another rally to test resistance at 11000 and, possibly, an upside breakout. This scenario is less likely though, with soft long-term treasury yields (see below) and bearish transport indicators both favoring continuation of the down-trend.
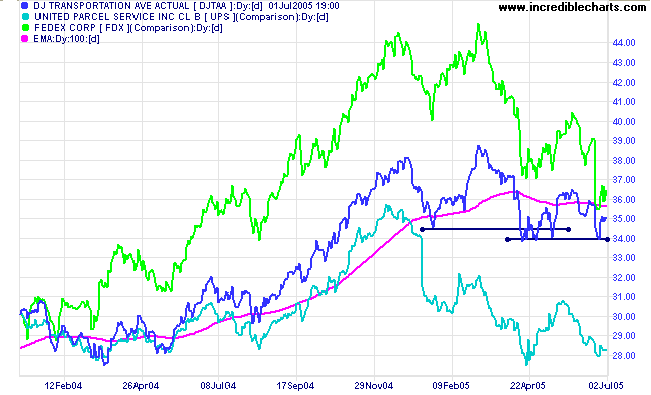
Transport indicators are falling. With Fedex and UPS in strong
primary down-trends, the Dow Jones Transportation Average appears
about to follow suit. A fall below 3400 would be a further bear
signal.
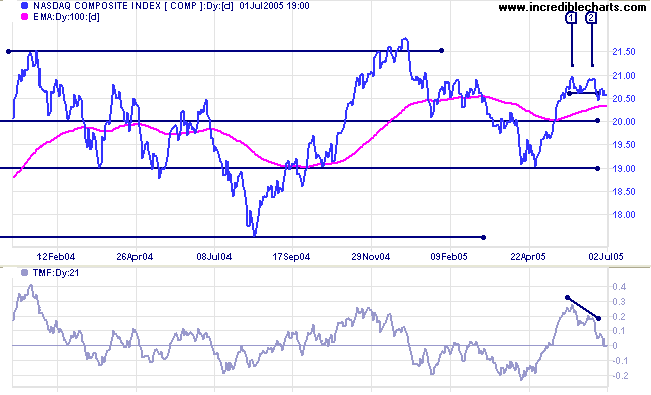
The Nasdaq Composite completed a narrow double
top at [1] and [2]. The subsequent marginal break was not
that convincing but a strong bearish
divergence on
Twiggs Money Flow (21-days) favors a test of support at 1900.
A close below Monday's low of 2040 would confirm.
A fall below 1900 would be a long-term bear signal.
A fall below 1900 would be a long-term bear signal.
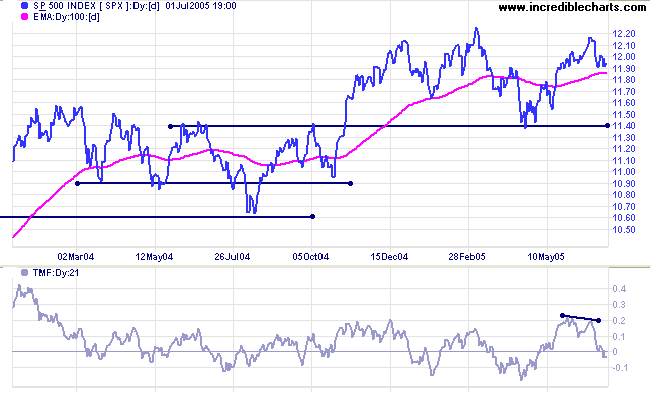
The S&P 500 has found short-term support at 1190 after
the recent reaction encountered resistance at 1205. Support is
unlikely to hold, especially with the bearish
divergence on
Twiggs Money Flow (21-day), and we can expect a test of
primary support at 1140. Failure of 1140 would complete a
downward breakout from the
rising wedge pattern formed over the last 18 months and
confirm the primary down-trend.
Though less likely, a rise above 1205 would signal another test of resistance at 1225 and a possible trend change.
Though less likely, a rise above 1205 would signal another test of resistance at 1225 and a possible trend change.
Technical Analysis - Not An Exact
Science
I believe that Technical Analysis should not be used to make predictions because we never know the outcome of a particular pattern or series of events with 100 per cent certainty. The best that we can hope to achieve is a probability of around 80 per cent for any particular outcome: something unexpected will occur at least one in five times. At times, especially when the market is in equilibrium, outcomes may be unclear and we could face several scenarios with fairly even probabilities.
Analysis is also separated into three time frames: short, intermediate and long-term. While one time frame may be clear, another may be uncertain. Obviously, we have the greatest chance of success when all three time frames are clear.
The market is a dynamic system. I often equate trading to a military operation, not because of its' oppositional nature, but because of the continual uncertainty created by conflicting intelligence (reports) and the element of chance that can disrupt even the best made plans. Prepare thoroughly, but allow for the unexpected. The formula is simple: trade when probabilities are in your favor; apply proper risk (money) management; and you will succeed.
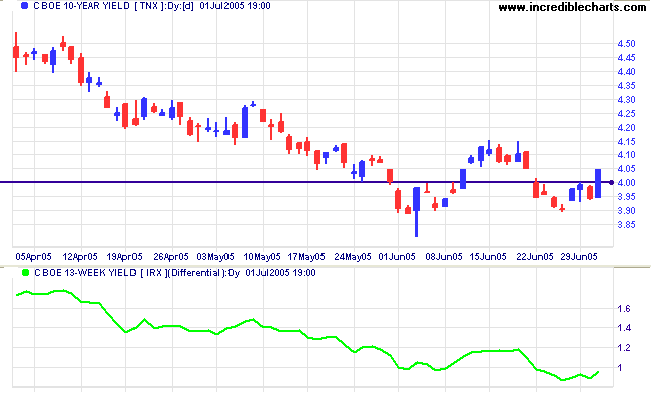
Treasury yields
The yield on 10-year treasury notes has encountered strong support at 4.0%, having made two marginal breaks below that level but retreating each time to the "right side". A rally back to 4.5% would be a positive sign for equities. Soft yields would signal that funds continue to flow out of equities and into bonds. If the yield is driven lower, we should see a corresponding fall in Twiggs Money Flow on the major indices.
The yield differential (10-year T-notes minus 13-week T-bills) below 1.0% is a (long-term) bear signal for equities.
Gold
New York: Spot gold fell sharply through support at $435 on Friday, plunging to $427.10 at the close. The promising breakout is off and we can expect a test of support at $415. A close below the support level would be a strong bear signal.
New York: Spot gold fell sharply through support at $435 on Friday, plunging to $427.10 at the close. The promising breakout is off and we can expect a test of support at $415. A close below the support level would be a strong bear signal.
On the 10-year chart we can see a strong band of support between
about $410 and $420.
LSE United Kingdom
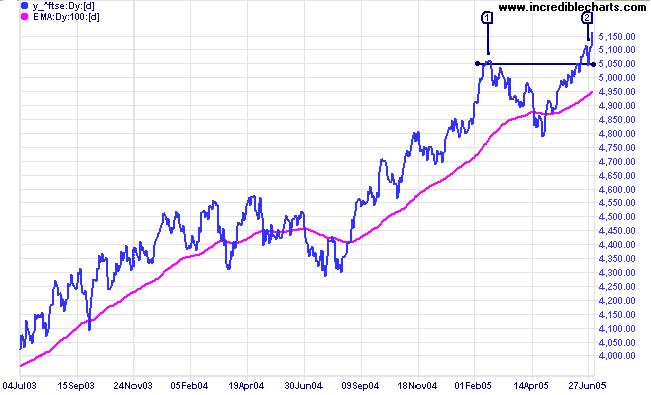
Contrary to US markets, the Financial Times 100 is in a strong primary up-trend, making new 3-year highs after successfully testing [2] support at 5050, from the February high.
Expect resistance around 5300 (from late 2001/early 2002) with a possible correction to test support at 5050/4800, while heavy overhead resistance is some way off, at 6600 to 6900.
The latest version of Incredible Charts allows users to import
data from a third party - Yahoo.com.
If testing is successful, the new version will be released later this month.
If testing is successful, the new version will be released later this month.
ASX Australia
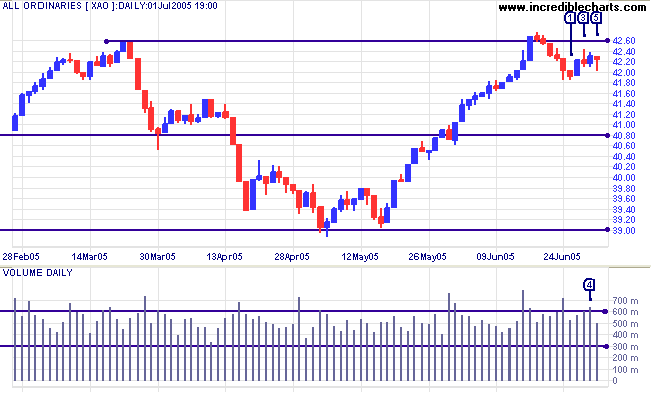
The All Ordinaries is consolidating in a narrow band below resistance at 4260/4275. Monday [1] failed to make a new low and was followed by a solid blue candle. A weak close on Wednesday [3] signaled the presence of sellers, while strong volume at [4] and the long tail at [5] show buying support. These are short-term levels that are unlikely to hold for long. Major (primary) resistance is at 4260/4275 and weaker (intermediate) support at 4180. If resistance holds, or support fails, expect a test of support at 3900.
The All Ordinaries is consolidating in a narrow band below resistance at 4260/4275. Monday [1] failed to make a new low and was followed by a solid blue candle. A weak close on Wednesday [3] signaled the presence of sellers, while strong volume at [4] and the long tail at [5] show buying support. These are short-term levels that are unlikely to hold for long. Major (primary) resistance is at 4260/4275 and weaker (intermediate) support at 4180. If resistance holds, or support fails, expect a test of support at 3900.
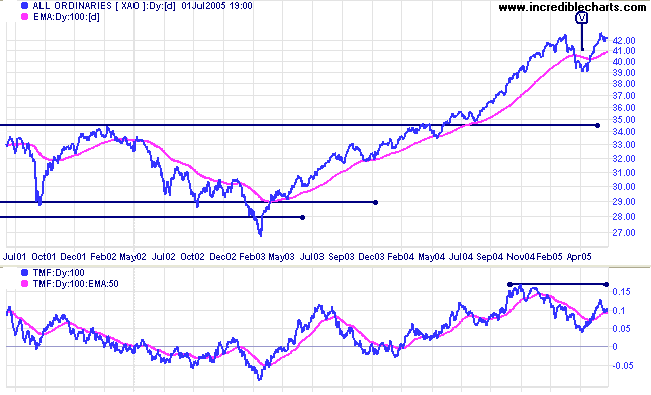
Twiggs Money Flow (100-day) is well below its November 2004
high and a retreat short of this level would signal long-term
distribution. A fall below the signal line would be
bearish.
A fall below [V] at 3900, on the index chart, would complete a double top formation, signaling that a test of 3450 is likely. On the other hand, if support holds at 3900 the primary trend is intact and we can expect further gains.
I am bearish about the All Ords' prospects. However, a breakout above 4260, followed by a pull-back that respects the new support level, is still a possibility and would signal further gains, with a target of 4620 (4260 + (4260 - 3900)).
For further assistance, read About
the Trading Diary.
Colin Twiggs
Never assume the obvious is true.
~ William Safire
~ William Safire
Back Issues
Access the Trading Diary Archives.